
Fig. 3.
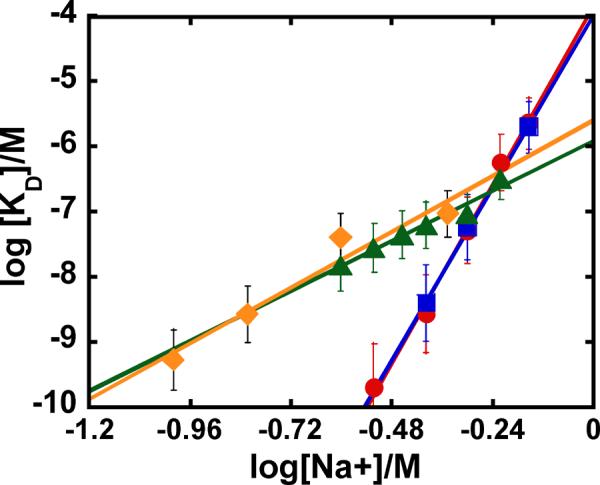
Salt dependence of PU.1 ETS-λB binding as observed by SPR. The KD values obtained from SPR kinetic data for PU.1 ETS-GGAA-1 complex formation under different experimental conditions are compared in this plot. (●) SA and (■) CM4 chip without nonspecific DNA, and (▲) CM4 and (◆) filter binding data with nonspecific DNA.