
Figure 1. Phylogenetic profiling analysis shows correlated conservation patterns ofC. elegans proteins.
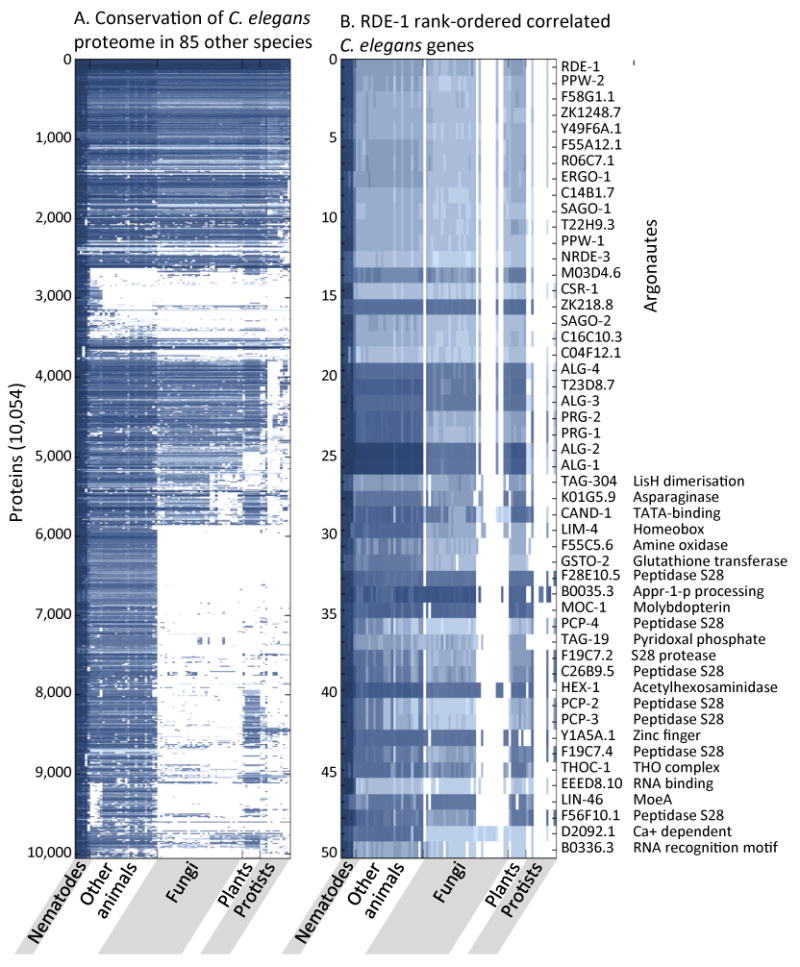
A. Phylogenetic profiles of 10,054 conserved C. elegans proteins across 85 other eukaryotic genomes. For each C. elegans query protein, the normalized ratio of the blastp score for the top scoring protein sequence similarity is listed in the column corresponding to each genome. Values range from 0 (white, no similarity) to 1 (blue, 100% similarity). B. Phylogenetic profiles of validated RNAi factor RDE-1 and the 49 most correlated proteins in rank order.