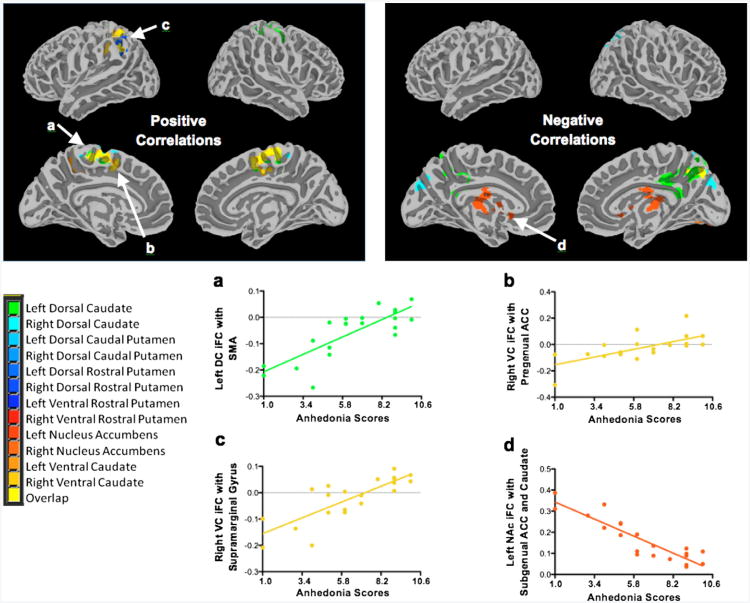
Figure 3.
Intrinsic functional connectivity (iFC) correlations with anhedonia scores and representative plots. Note: Maps showing regions with iFC (left) positively correlated with anhedonia severity and (right) negatively correlated with anhedonia severity. Plots a–d below demonstrate several of these relationships. Additional plots are available in Figure S4, available online. Display threshold: Z > 2.3. ACC = anterior cingulate cortex; DC = dorsal caudate; NAc = nucleus accumben; SMA = supplementary motor area; VC = ventral caudate.

