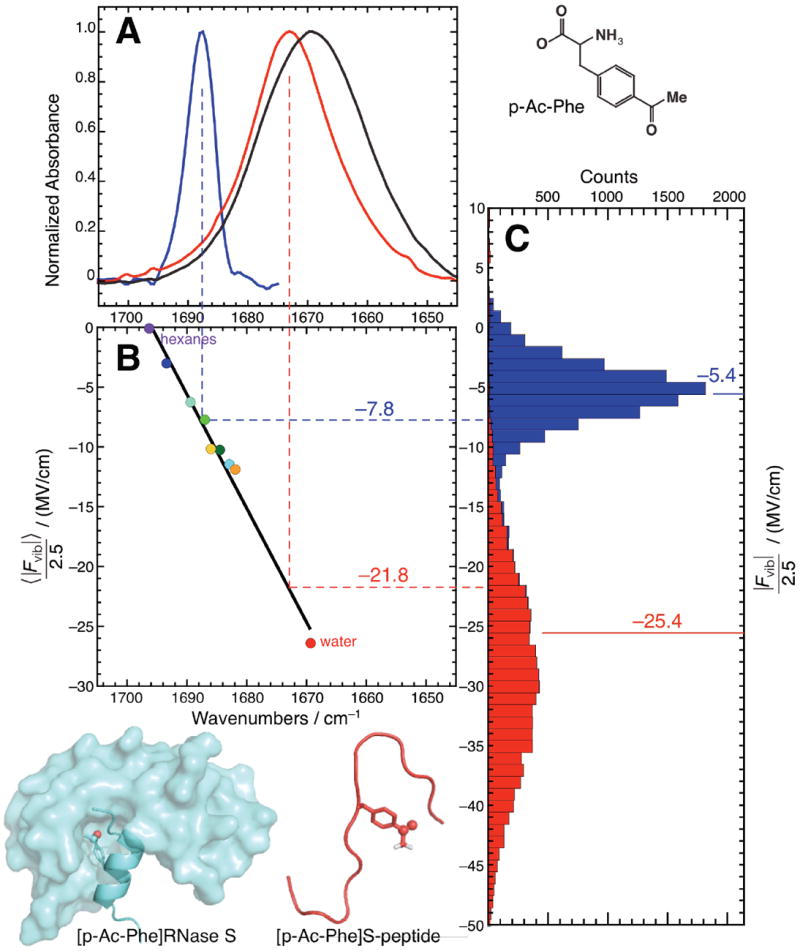
Figure 3.

A solvatochromic model calibrates C=O vibrational frequency to electrostatic field. (A) FTIR spectra of p-Ac-Phe (black), [p-Ac-Phe]S-peptide (red) and [p-Ac-Phe]RNase S (blue). (B) The solvatochromic field-frequency correlation plot from Figure 2B (rotated by 90°) with rescaled fields used to convert the peak frequencies of the two spectra in (A) to predictions for ensemble-averaged electric fields (illustrated with dotted lines). This process yields values of − 21.8 MV/cm for [p-Ac-Phe]S-peptide and −7.8 MV/cm for [p-Ac-Phe]RNase S. (C) Histograms of |Fvib|/2.5 from the MD simulations of [p-Ac-Phe]S-peptide and [p-Ac-Phe]RNse S. The means (marked with solid lines) are −5.4 MV/cm and −25.4 MV/cm, which differ from their predicted values by 31% and 16% respectively.
