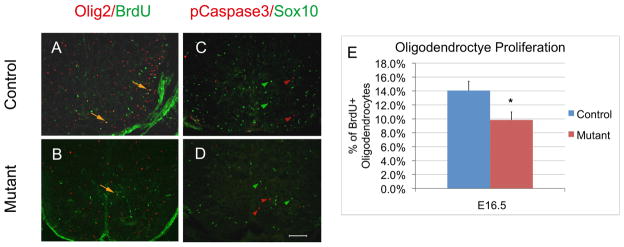
Figure 4.

Assays of oligodendrocyte proliferation and apoptosis in E16.5 spinal cords. A–B. Double immunofluorescent staining with anti-BrdU and anti-Olig2. Double-stained cells are represented by arrows. C–D Double immunostaining with anti-pCaspase 3 and anti-Sox10. Green and red arrowheads represent oligodendrocytes and apoptotic cells, respectively. Scale bar, 100 μm. (E) The percentage of BrdU labeled Olig2+ cell at E16.5. More than 400 Olig2-positive and BrdU/Olig2 double positive cells from 4 different sections were counted under 10X magnification (*P<0.01).
