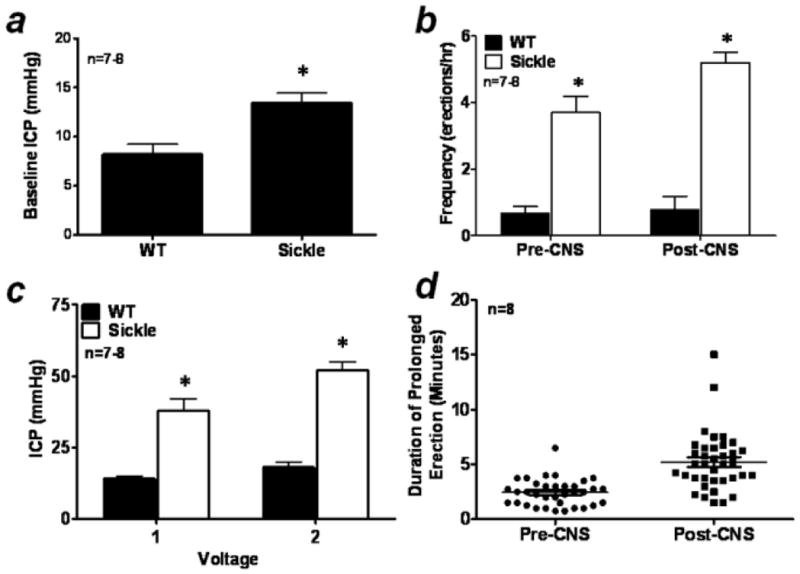
Figure 1.

(A) Baseline resting intracavernous pressure (ICP); (B) bar graph demonstrating the frequency of spontaneous erections (erections/hr) pre- and post- cavernous nerve stimulation (CNS; 2 V) in WT and transgenic Sickle cell (Sickle) mice; (C) voltage dependent erectile responses to CNS showing peak ICP; (D) duration (mins) of spontaneous prolonged erections in Sickle mice. n = number of experiments; * p<0.05 vs WT. For all panels, data expressed as mean values ± SEM.
