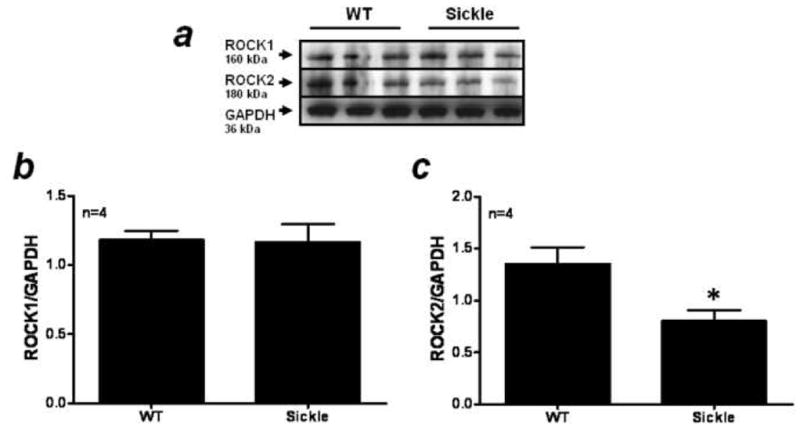
Figure 2.

(A) Western blot analysis demonstrating expression of ROCK1, ROCK2 and GAPDH protein in penes of WT (lanes 1–3) and Sickle (lanes 4–6) mice. Densitometry analysis of the ratio of ROCK1 (B) and ROCK2 (C) to GAPDH protein expression in WT and Sickle mice penes. n indicates number of tissue samples; * p<0.05 when compared to WT.
