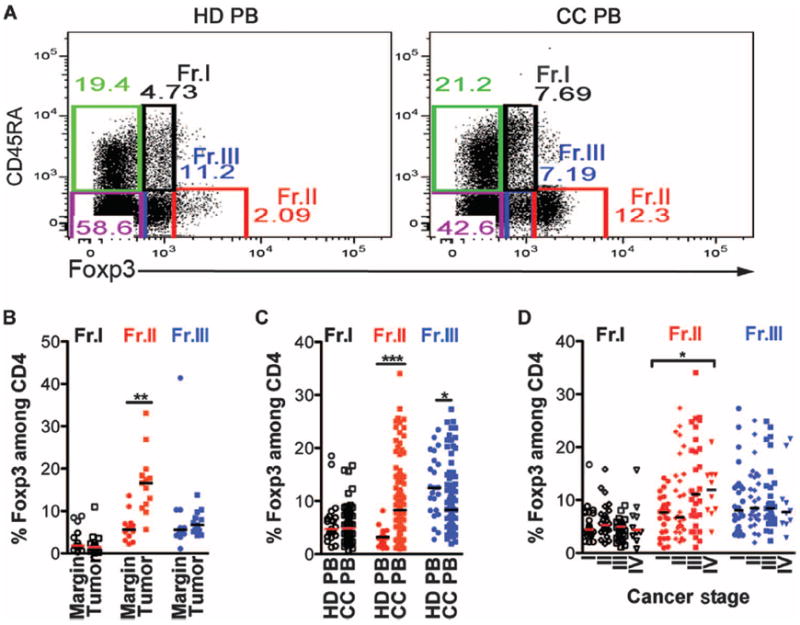
Fig. 1.

In human CC, Fr.II Tregs expand in a cancer stage–dependent manner. (A) Representative dot plots depicting flow cytometry gating of five T cell fractions: three of which are Foxp3+ and two are Foxp3−. The Foxp3+ cells are labeled as Fr.I (black, CD45RA+Foxp3int), Fr.II (red, CD45RA−Foxp3high), and Fr.III (blue, CD45RA−Foxp3int). Non-Foxp3 T cells can be divided into naïve CD45RA+Foxp3− (green) and memory CD45RA−Foxp3− (purple). Cells were pregated on live CD4+CD8− cells. (B) Compiled frequencies of Treg subtypes among CD4 T cells frommarginal or tumor tissue as determined by FACS analysis (n = 13). (C) Compiled frequencies of Treg subtypes among CD4 T cells from PBMCs of HD or CC patients. HD, n = 23; CC, n = 94. (D) CC PBMC Treg subtype frequencies according to the cancer stage of each CC patient as defined by the International Union for Cancer Control. Fr.I: white circles, HD; white squares, CC; Fr.II: red circles, HD; red squares, CC; Fr.III: blue circles, HD; blue squares, CC. Statistics are found in table S2. Bar represents median. Each dot in (B) to (D) represents one patient; value was determined from an average of at least two separate FACS stainings.
