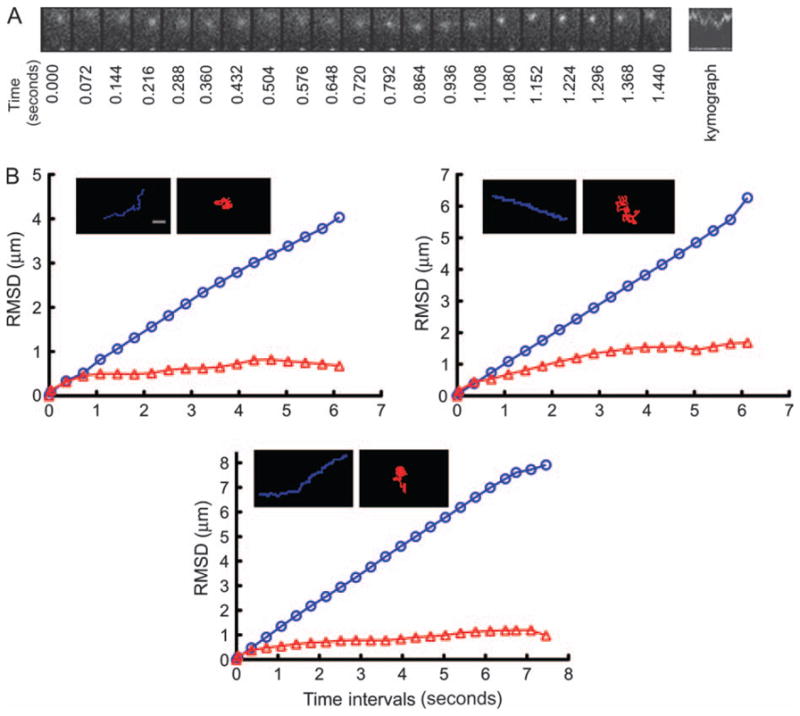
Figure 1. G-clathrin structures display localized waving movement.

A) GFP–clathrin-transfected COS-1 cells were imaged at 36-millisecond intervals. A motile clathrin spot displaying waving movement is shown in the montage of frames captured at the indicated time-points, and in the corresponding kymograph of distance versus time. The movement is characterized by frequent directionality transitions accompanied by intensity changes, likely because of z-axis movements. Region size is 3 × 2 μm. B) Trajectories and root mean square displacements (RMSD) of clathrin spots during a 5 to 10 second tracking period. Three examples of spots exhibiting either linear vectorial motion (blue) with large RMSD, or gyrating motion (red) with small RMSD, are presented. Bar, 1 μm.
