
Figure 2. G-clathrin structures contain GGA1.
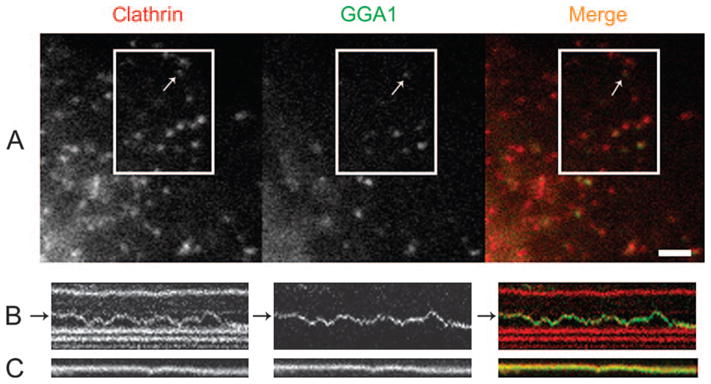
A) YFP-GGA1 signals extensively co-localized with mCherry–clathrin; arrow indicates a G-GGA/clathrin structure. B) Kymographs from several spots in the boxed region reveal the identical behavior over time of GGA1 and clathrin in moving (panel B) and stationary (panel C) GGA1–clathrin structures (also see Video S4); kymograph total duration 6.5 seconds. Bar, 2 μm.