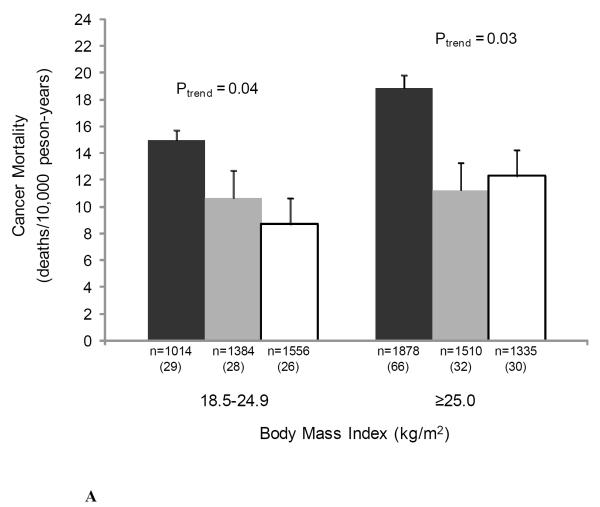
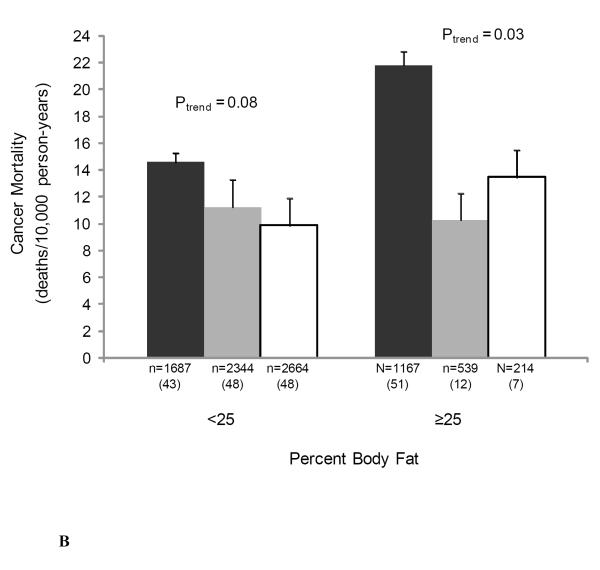
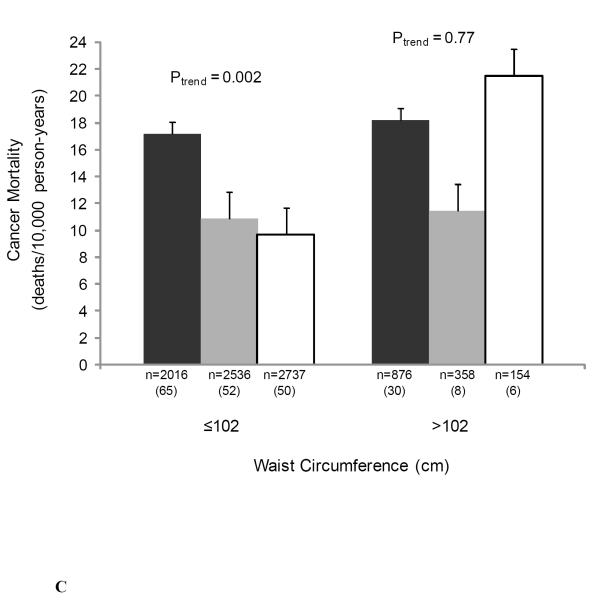
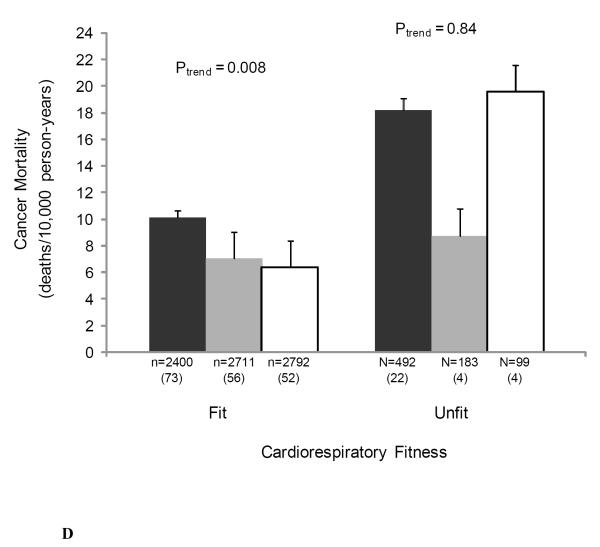
Figure 1.
Joint association of muscular strength and (1A) body mass index (BMI), (1B) percent body fat, (1C) waist circumference, and (1D) cardiorespiratory fitness with the age- and examination year-adjusted rates of cancer mortality, Aerobics Center Longitudinal Study, 1980-2003. Error bars represent standard error. Likelihood ratio test for interaction, χ2df=1 = 0.70, P = 0.40 for BMI-strength, χ2df=1 = 0.51, P = 0.48 for percent body fat-strength, χ2df=1 = 0.77, P = 0.38 for waist circumference-strength, and χ2df=1 = 1.74, P = 0.19 for cardiorespiratory fitness-strength. Black bars represent the lowest third; grey bars, the middle third; and white bars, the upper third of baseline muscular strength. Numbers under the bar are sample size (deaths from cancer).


