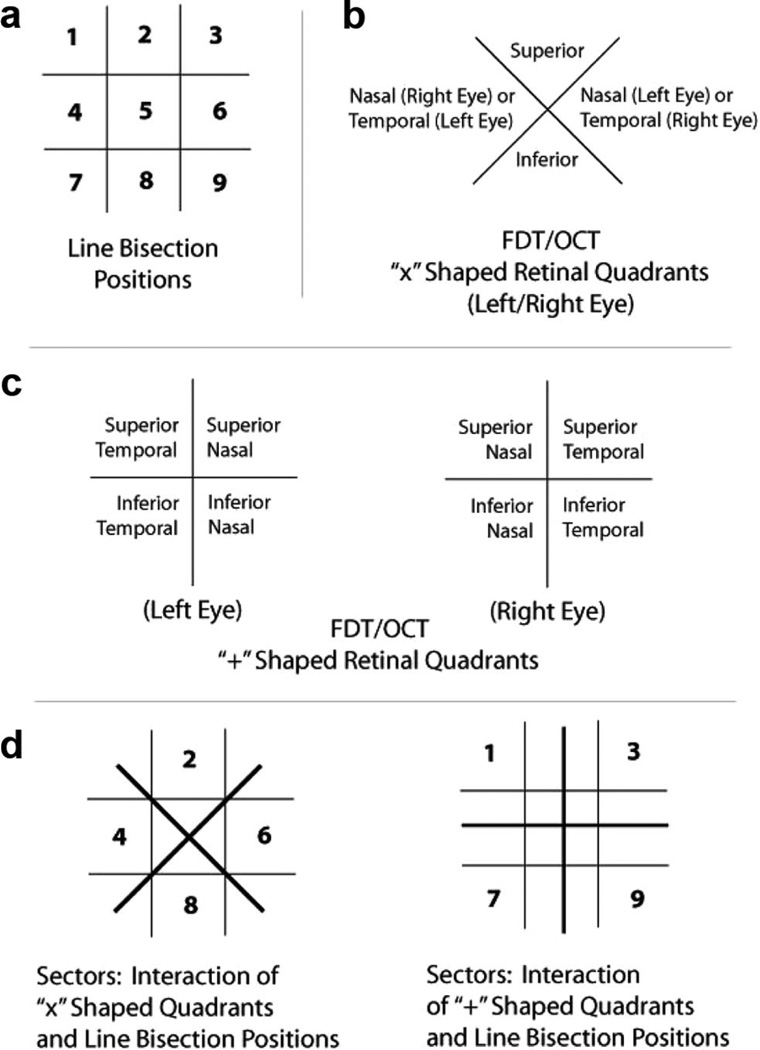
Figure 1.
Visualization of line bisection positions, frequency-doubling technology (FDT) and optical coherence tomography (OCT) retinal quadrants, and schematics of sectors. Grid lines are for illustrative purposes in this figure and were not visible to the participants. Note: the optics of the lens of the eye invert (top to bottom) and reverse (left to right) an external image that is projected onto the retina. Therefore, in analyses that relate retinal quadrants to line bisection positions (i.e., Figure 1d), retinal quadrants were matched to their corresponding image source location.

