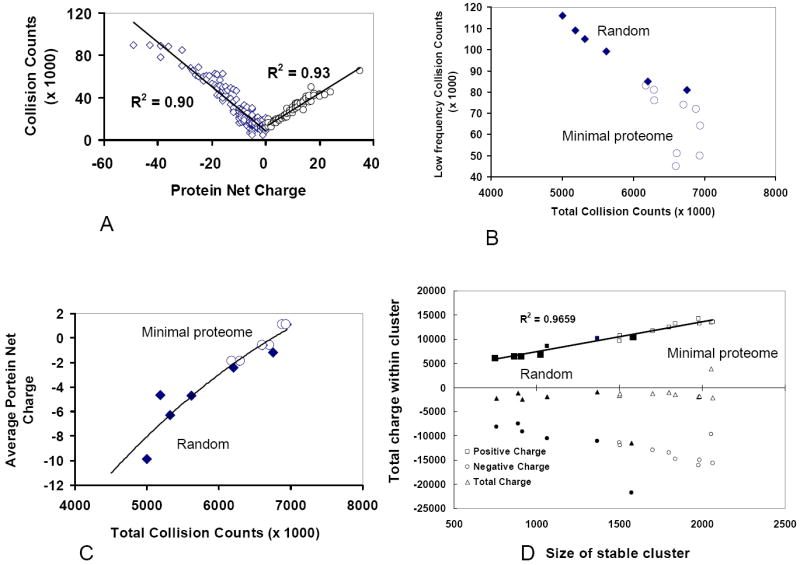
Figure 4.

Net charge controls protein interaction network. (A) Collision rate increases linearly with the absolute charges on the proteins, i.e. it increases with the net positive and negative charges. The result from minimal proteome yeast set is shown; similar results were obtained from the simulations of MC4100 and DY330 sets. (B) The minimal proteome models have high total collision count because there are fewer proteins with low collision frequencies, which are the summation from the lowest 10 proteins. The diamonds are for the simulations of the random proteomes, and the circles represent the minimal proteome models (each with three runs). (C) The total collision counts within a proteome increase with the number of positively charge proteins. (D) The size of the stable cluster depends on the ratio between negatively and positively charged proteins with different masses. The minimal proteome models have larger stable cluster size.
