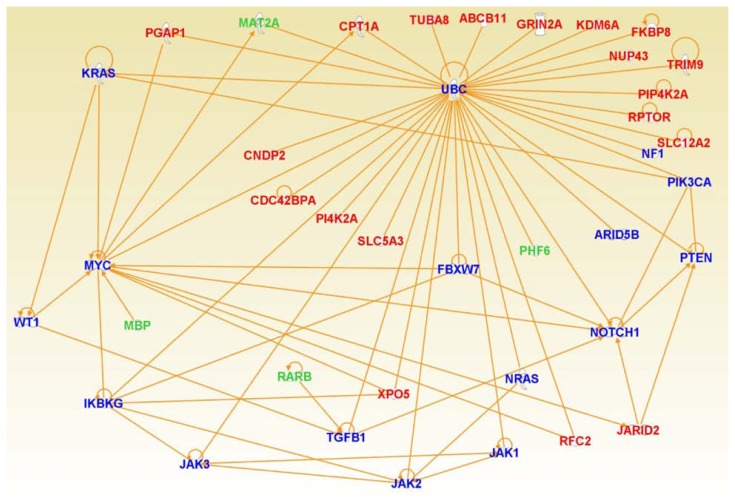
Figure 8.
Graphical representation of a consensus gene regulatory network enriched for genes significantly differentially expressed between ethnic populations (red) and genes from the literature that have been implicated B-ALL (blue). Genes in green font represent the significantly differentially expressed genes identified in this study that have been directly implicated in B-ALL. Solid lines indicate direct interactions and functional relationships.

