
Figure 1.
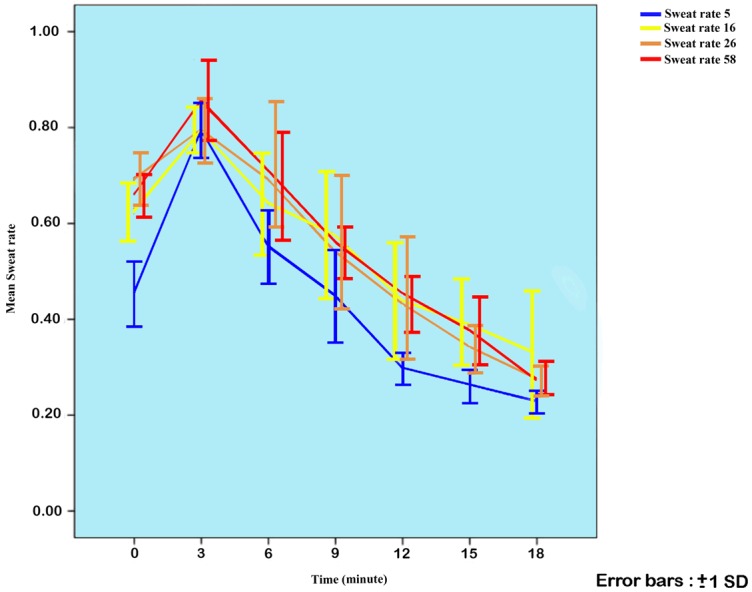
Sweat rates during trials with different water temperatures shown as mean ± SD. The point of 0 min represents the time of drinking. Error bars have been moved slightly to be discriminated.
Official websites use .gov
A
.gov website belongs to an official
government organization in the United States.
Secure .gov websites use HTTPS
A lock (
) or https:// means you've safely
connected to the .gov website. Share sensitive
information only on official, secure websites.
Sweat rates during trials with different water temperatures shown as mean ± SD. The point of 0 min represents the time of drinking. Error bars have been moved slightly to be discriminated.