Figure 3.
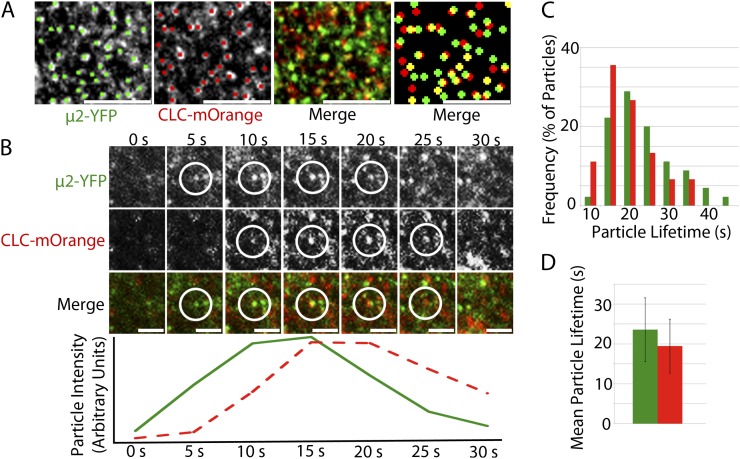
μ2-YFP and CLC-mOrange puncta colocalize and exhibit transient behavior at the plasma membrane with similar temporal behavior. A, Single-frame images show colocalization between μ2-YFP and CLC-mOrange particles at the plasma membrane. Manual particle selection was used to enhance the detection of colocalized particles. The left merge image displays two signals without manual particle selection, while the right merge image displays enlarged manually selected particles. Bars = 5 μm. B, Colocalized μ2-YFP and CLC-mOrange particles appear and disappear together at the plasma membrane. The fluorescence intensity profiles of the μ2-YFP (green trace) and CLC-mOrange (red dashed trace) are displayed in arbitrary units below the images for each time point. Shown is one representative instance chosen from more than 100 documented events. C, A histogram shows the distribution of μ2-YFP and CLC-mOrange particle lifetimes at the plasma membrane. D, Mean lifetime of μ2-YFP and CLC-mOrange particles (n = 45 particles for each μ2-YFP and CLC-mOrange). Error bars represent sd.

