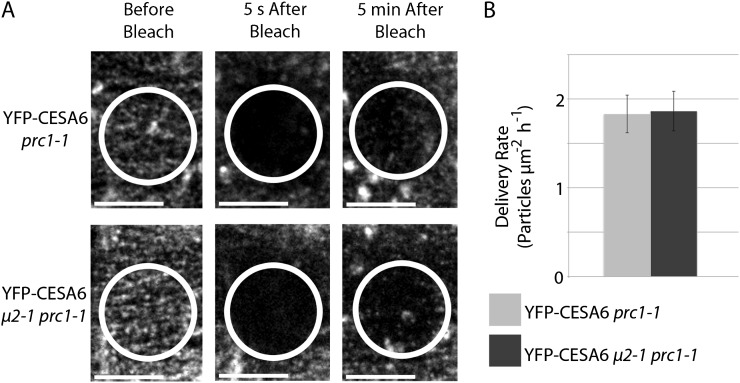
Figure 7.
The delivery rate of YFP-CESA6 is similar in μ2-1 prc1-1 and the prc1-1 control. A, Representative images show the repopulation of the plasma membrane with YFP-CESA6 particles during the 5 min after the photobleaching of a ROI. Large signals from intracellular YFP-CESA6 that transiently passed through the ROI were not scored in the quantification of delivery. Bars = 10 μm. B, The quantification of the delivery rate shows no significant difference in the delivery of YFP-CESA6 in μ2-1 prc1-1 (dark gray bar) and prc1-1 (light gray bar) backgrounds (n = 5 seedlings for each μ2-1 prc1-1 and prc1-1). Error bars represent sd.

