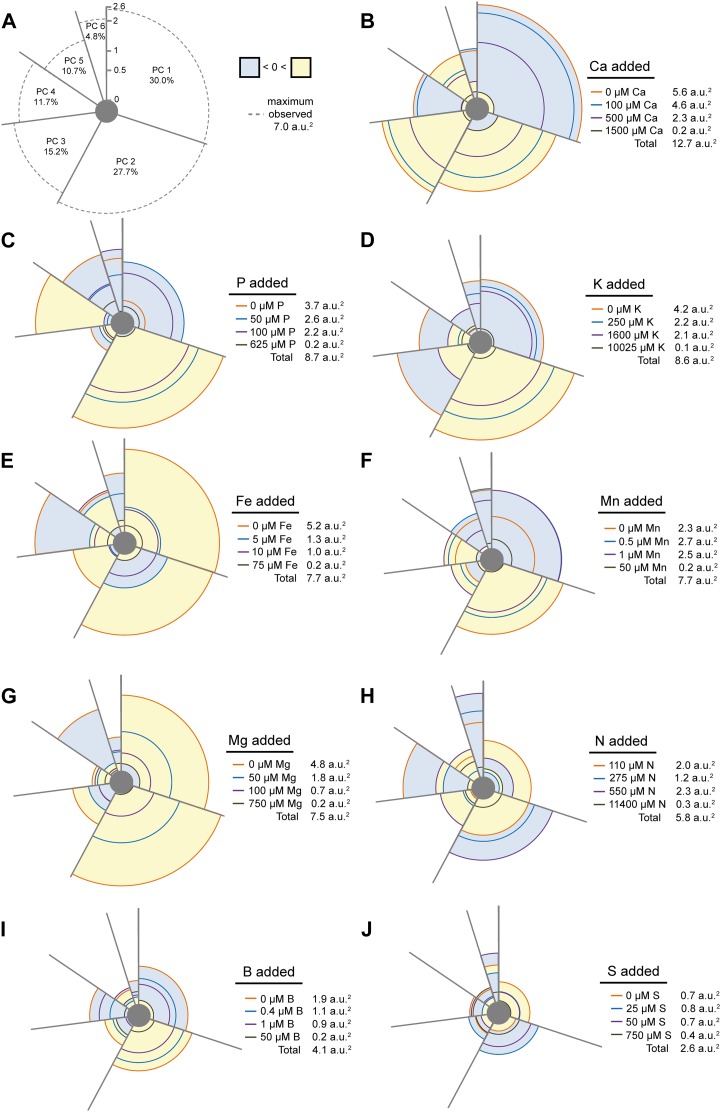
Figure 11.
The plasticity of the RSA to nutrient deficiencies. A PCA was undertaken on independent root traits, and the mean component scores for each of the treatments in all six principal components are represented. A, The eigenvalues for each principal component are indicated within each portion of the pie, as is the maximum observable component score for each principal component (represented by the dashed line). The pie chart is divided such that the radial magnitude of each portion is proportional to the experimental variation explained in that principal component (i.e. the eigenvalue). The mean component score for each treatment is graphed along the axis of the chart, with positive scores shaded yellow, negative scores shaded blue, and the zero point representing the mean component score of the 1/2 MS control treatments from all experiments. B to J, Plasticity charts are shown for Ca (B), P (C), K (D), Fe (E), Mn (F), Mg (G), N (H), B (I), and S (J). The area enclosed by each treatment represents the total RSA change relative to the mean of the controls and is expressed as a value adjacent to the legend in each panel in arbitrary units (a.u.2).

