Figure 4.
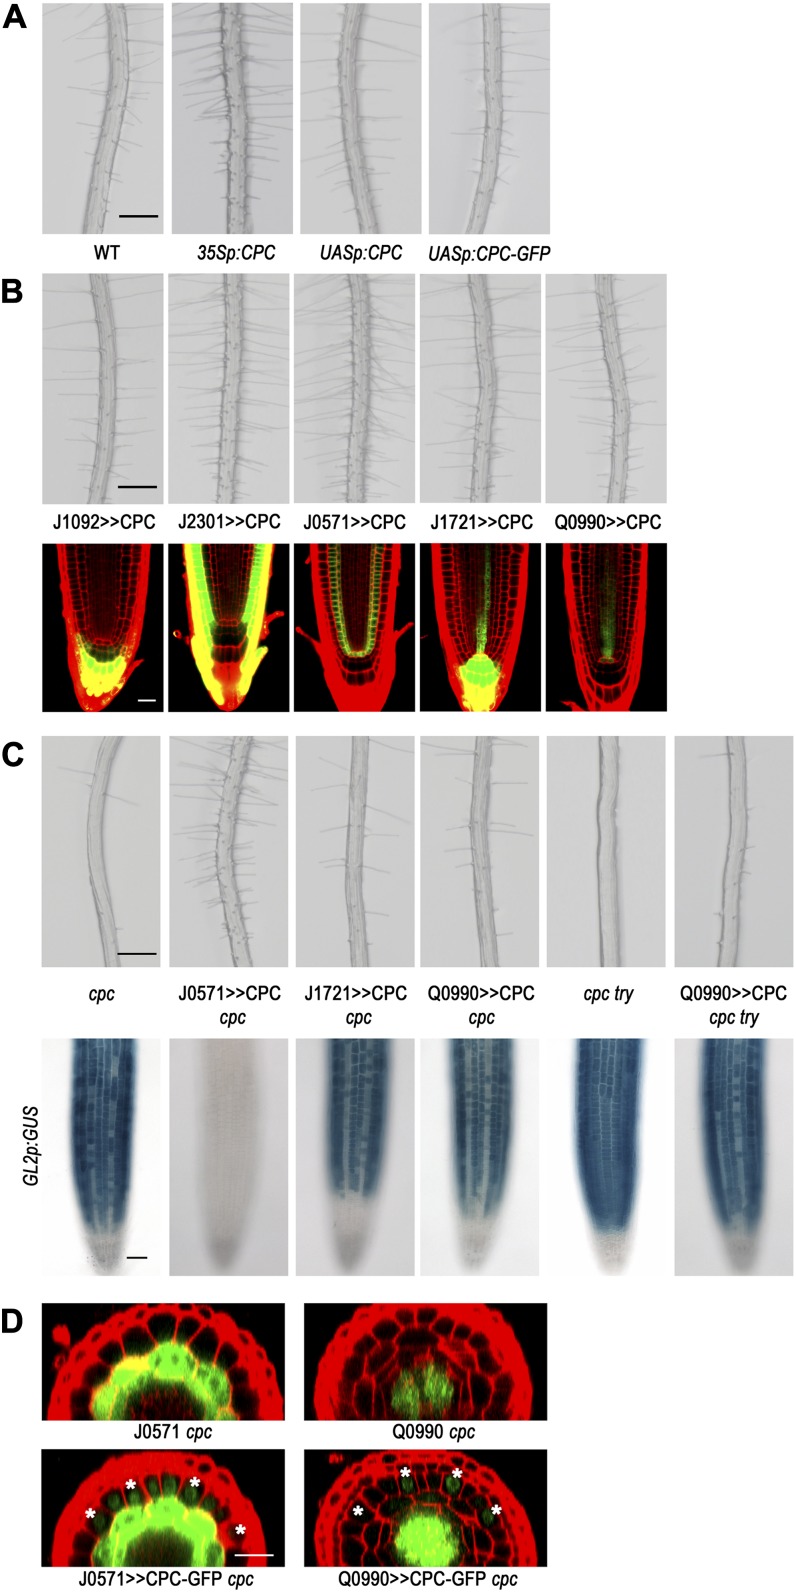
CPC expressed in different tissue layers using the GAL4-UAS system affects cell fate specification in the root epidermis. A, Four-day-old seedlings illustrating root hair production. Bar = 200 μm. B, Root hair phenotype for the plants expressing CPC in a specific tissue in the wild-type root (top; bar = 200 μm). The plant harboring the UASp:CPC was crossed with the each enhancer trap line. Confocal microscope images indirectly show the CPC-expressing tissues (bottom; bar = 20 μm). C, Root hair phenotype (top) and GL2p:GUS expression pattern (bottom) in the plants expressing CPC in a specific tissue in the cpc mutant background. Bars = 200 μm (top) and 50 μm (bottom). D, CPC moves from the stele cells to the epidermis in the root. The strong GFP signal throughout the cell represents the signal from the endogenous GFP of the enhancer trap lines. The GFP fluorescence signal in the nucleus of the cells outside the ground tissue (in the case of the J0571 cpc) and the cells outside the stele cells (in the case of the Q0990 cpc) were detected only in the plants harboring UASp:CPC-GFP, implying that this signal represents the CPC-GFP protein. The H-position epidermal cells are marked with an asterisk. Bar = 20 μm.

