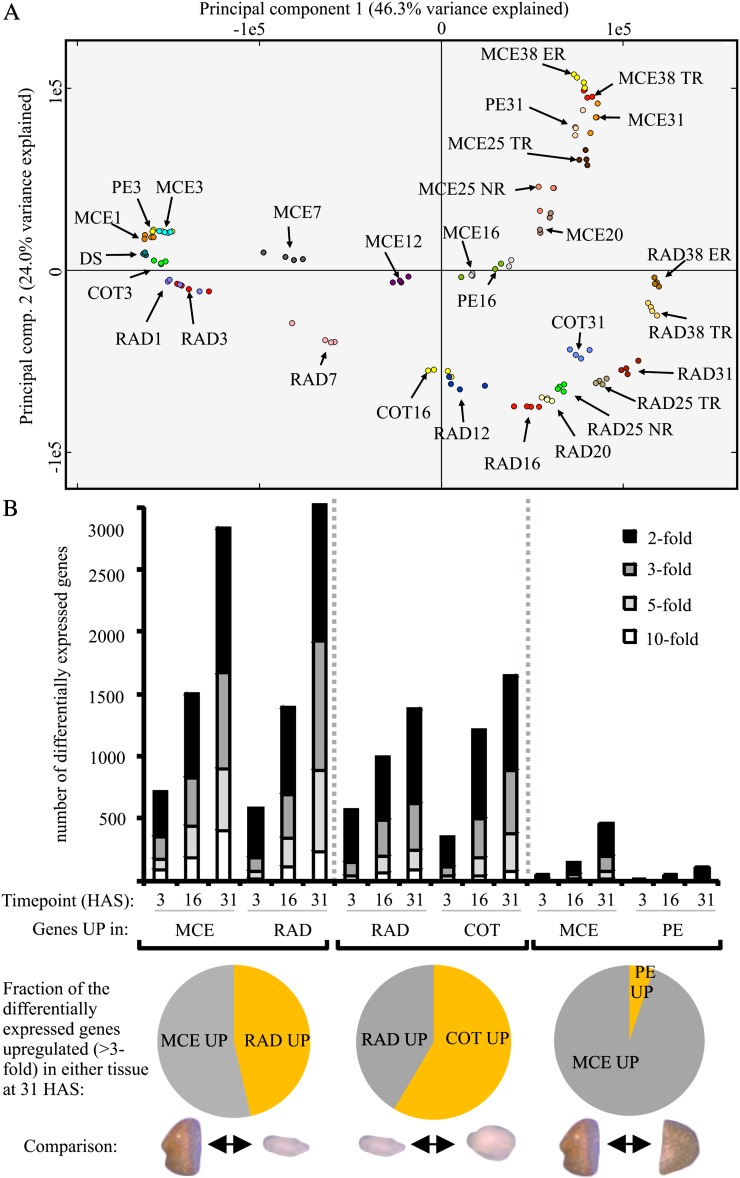
Figure 2.
Transcriptional differences between seed compartments. A, PCA of the 116 samples. The four replicates of all 29 samples are indicated by color. B, Tissue differences are represented by the number of differentially expressed genes at three time points during imbibition (3, 16, and 31 HAS, the time points in which all four tissues were sampled). Comparisons were made between endosperm and embryo (MCE versus RAD), between embryo tissues (RAD versus COT), and between both endosperm samples (MCE versus PE). The bars show the number of differentially expressed genes at a 2-, 3-, 5-, and 10-fold cutoff. The pie diagrams below the graph indicate the fraction of the total number of differentially expressed genes (at a 3-fold cutoff level) in either of the two tissues that were compared at 31 HAS.

