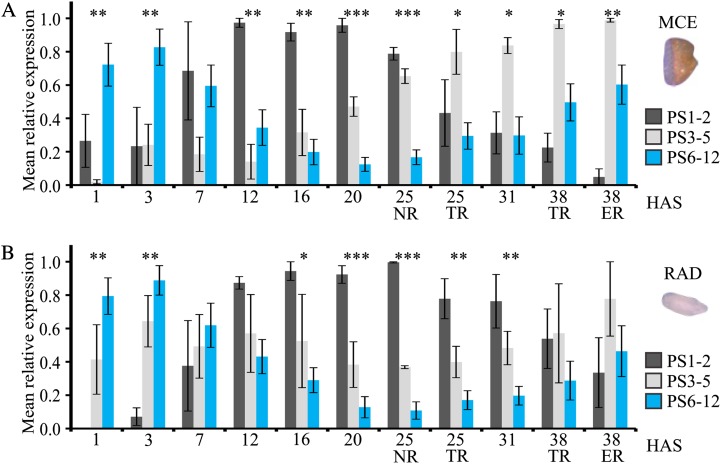
Figure 8.
Relative expression of evolutionarily old and young genes across the Arabidopsis germination time course. Plotted are the relative expression levels ± se of genes of PS1 and PS2, PS3 to PS5, and PS6 to PS12 across the Arabidopsis germination time course in the MCE (A) and RAD (B) compartments. The significance between the relative expression levels between the groups is indicated at each time point by asterisks: *P < 0.05, **P < 0.01, ***P < 0.001. For the phylostratigraphic map and the mean relative expression of individual phylostrata, see Supplemental Figure S9.

