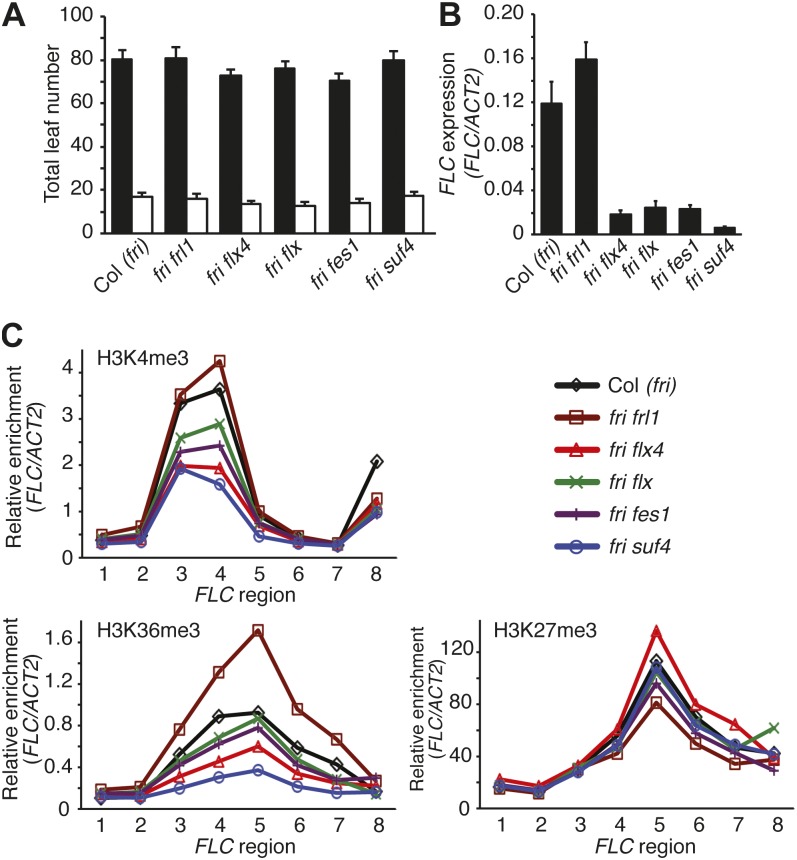
Figure 6.
FRI-independent promotion of FLC expression by FLX4, FLX, FES1, and SUF4. A, Flowering time of FRI pathway mutants in Col-0 (fri) under short (black bars) or long days (white bars). B, FLC expression as determined by qRT-PCR. Error bars = 1 sd (A and B). C, Analysis of histone modifications by ChIP-qPCR. sds are shown in Supplemental Figure S5.

