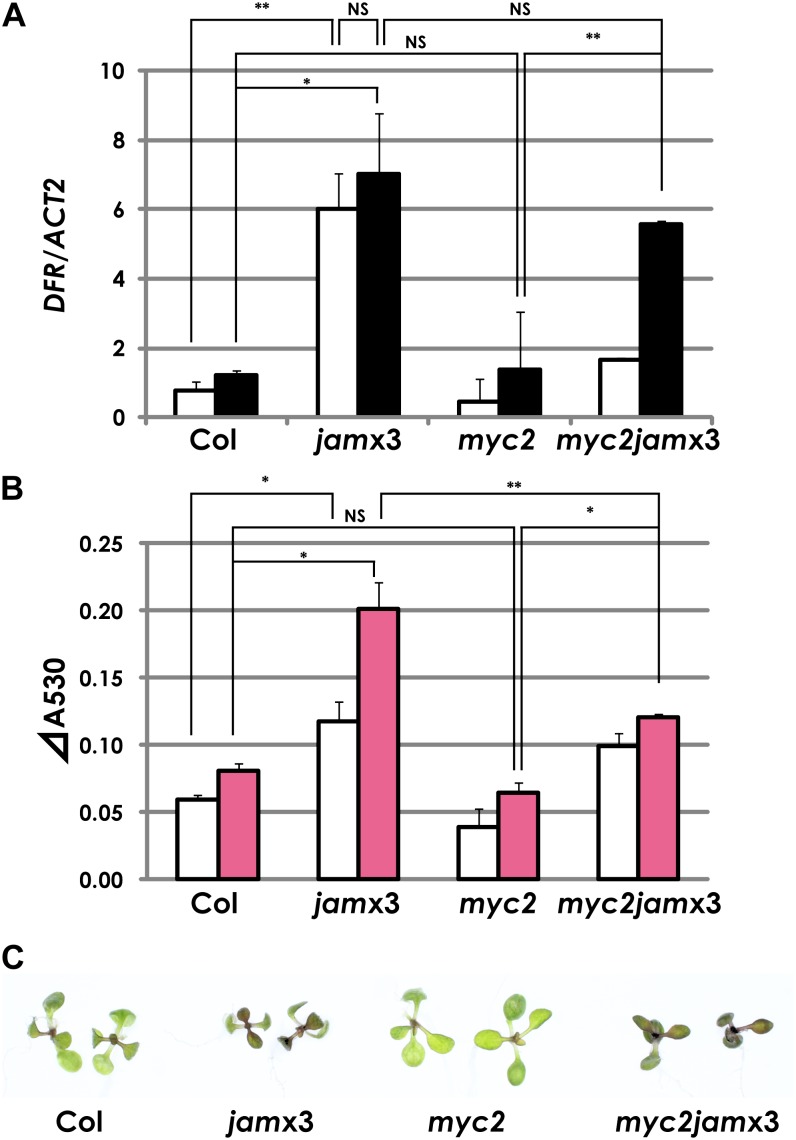
Figure 7.
JAMs negatively regulate anthocyanin biosynthesis. A, Expression profiles of the anthocyanin biosynthetic gene DFR in Col-0, jamx3, myc2, and myc2jamx3 plant seedlings. Col-0 and mutant plants were grown in liquid GM containing 1% Suc. Total RNA was isolated from plants 1 h after mock or 50 μm MJ treatment. Averaged data from three independent experiments with error bars (se) are presented. White bars represent mock treatment, and black bars represent 50 μm MJ treatment. B, Anthocyanin levels in Col-0, jamx3, myc2, and myc2jamx3 plant seedlings. Plants were grown in liquid GM containing 1% Suc for 7 d and then treated with mock or 50 μm MJ for 24 h. Results shown are means ± se of three independent experiments. White bars represent mock treatment, and pink bars represent 50 μm MJ treatment. **P < 0.01, *P < 0.05, NS = not significant (P > 0.05), by Tukey-Kramer multiple comparison test. C, Photographs of Col-0, jamx3, myc2, and myc2jamx3 plants that were grown in liquid GM with 1% Suc and treated with 50 μm MJ for 24 h.

