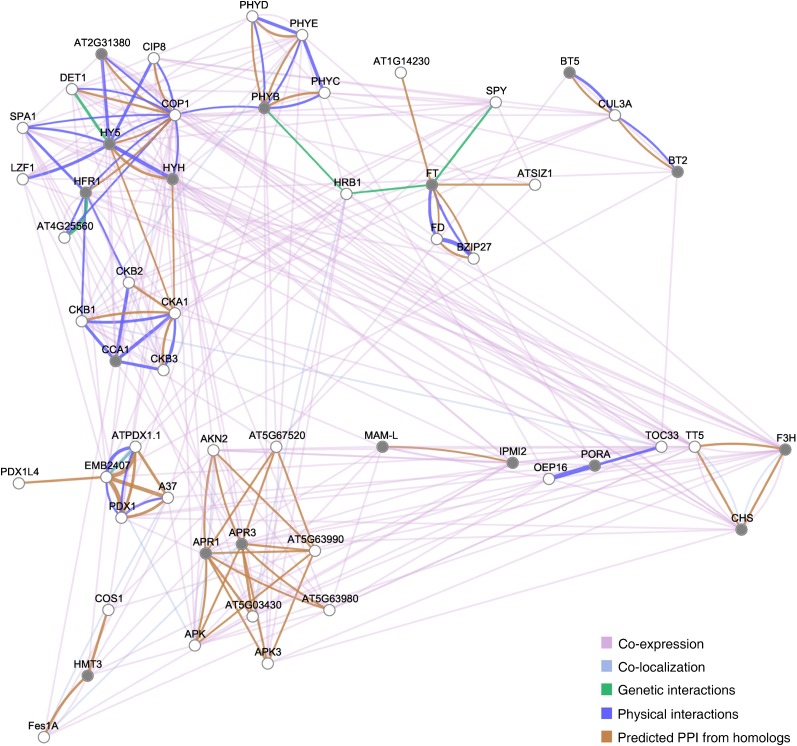
Figure 4.
Network analysis of genes regulated late in the shade-avoidance response. DAVID functional clusters of genes regulated upon 1 d of exposure to low R/FR were utilized to infer gene networks by means of the GeneMANIA server using available genomics and proteomics data. Networks are represented as graphs, in which the nodes correspond to genes and the edges correspond to interactions between them. Nodes colored with gray indicate significant differential gene expression with respect to the control in our array data (Supplemental Table S3; for details, see “Materials and Methods”). PPI, Protein-protein interactions.

