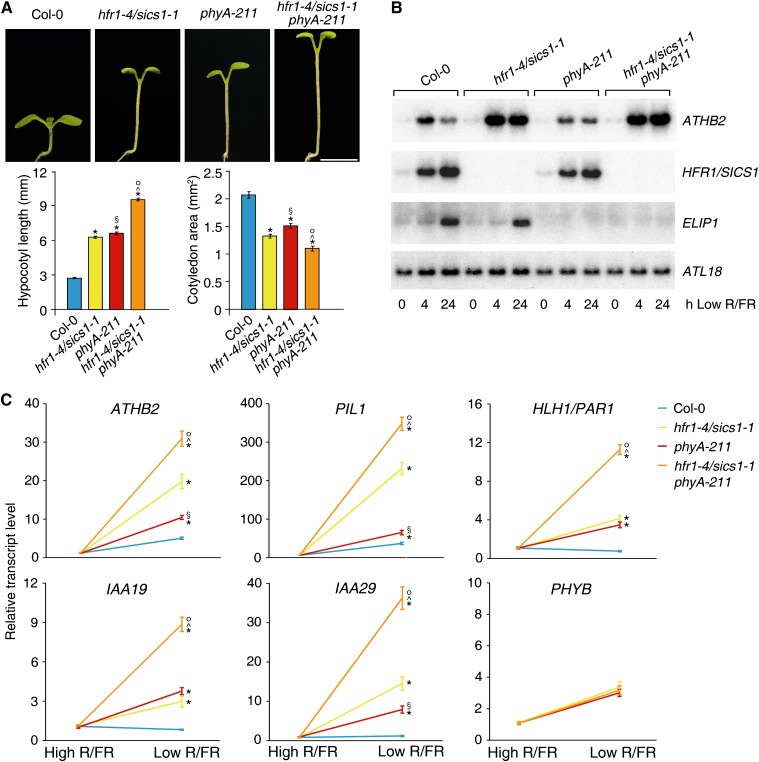
Figure 8.
HFR1/SICS1 and phyA act largely independently in the regulation of the shade-avoidance response. A, Col-0, hfr1-4/sics1-1, phyA-211, and hfr1-4/sics1-1 phyA-211 seedlings grown for 4 d in a L/D cycle (16/8 h) in high R/FR and then transferred to low R/FR for 4 d under the same L/D regimen. The histograms depict the mean ± se hypocotyl lengths (left) and the mean ± se cotyledon areas (right) of seedlings grown as described. At least 30 seedlings were analyzed for each line. Statistical significance was assessed by means of one-way ANOVA followed by Tukey’s test. *P < 0.01 for hfr1-4/sics1-1, phyA-211, and hfr1-4/sics1-1 phyA-211 versus Col-0; §P < 0.01 for phyA-211 versus hfr1-4/sics1-1; ^P < 0.01 for hfr1-4/sics1-1 phyA-211 versus hfr1-4/sics1-1; °P < 0.01 for hfr1-4/sics1-1 phyA-211 versus phyA-211. Bar = 3 mm. B, Northern-blot analyses of ATHB2 and HFR1/SICS1 in Col-0, hfr1-4/sics1-1, phyA-211, and hfr1-4/sics1-1 phyA-211. Plants were grown for 7 d in a L/D cycle (16/8 h) in high R/FR (0) and then transferred to low R/FR under the same L/D regimen. Plant transfer to low R/FR was performed 4 h after the beginning of the light period, and seedlings were harvested 4 and 24 h later for northern-blot analyses. ELIP1 is a gene not differentially regulated by low R/FR in hfr1/sics1 mutants relative to the wild type. ATL18 was used to monitor equal loading. C, RT-qPCR analyses of ATHB2, PIL1, HLH1/PAR1, IAA19, and IAA29 in Col-0, hfr1-4/sics1-1, phyA-211, and hfr1-4/sics1-1 phyA-211. Plants were grown for 7 d in a L/D cycle (16/8 h) in high R/FR and then either maintained in high R/FR or transferred to low R/FR under the same L/D regimen for 1 d. Plant transfer to low R/FR was performed 4 h after the beginning of the light period. The graphs show the relative expression levels in high and low R/FR of ATHB2, PIL1, HLH1/PAR1, IAA19, and IAA29 in the different genotypes. PHYB is a gene not differentially regulated by low R/FR in mutant seedlings relative to the wild type. Each value is the mean ± sd of five biological replicates normalized to EF1α expression. Statistical significance was assessed by means of one-way ANOVA followed by Tukey’s test. *P < 0.001 for hfr1-4/sics1-1, phyA-211, and hfr1-4/sics1-1 phyA-211 versus Col-0; §P < 0.001 for phyA-211 versus hfr1-4/sics1-1; ^P < 0.001 for hfr1-4/sics1-1 phyA-211 versus hfr1-4/sics1-1; °P < 0.001 for hfr1-4/sics1-1 phyA-211 versus phyA-211.

