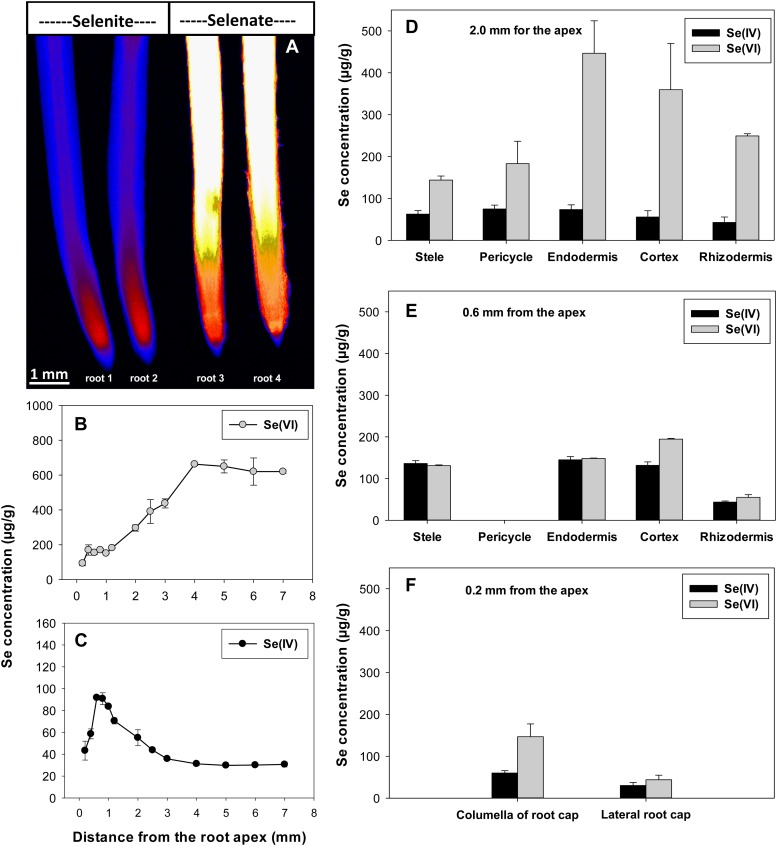
Figure 4.
A, Imaging of Se in cowpea roots exposed to 20 µm Se[IV] or Se[VI] for 24 h using µ-XRF. B and C, Longitudinal distribution of Se along the root axis. D to F, Radial distribution of Se at distances of 2.0, 0.6, and 0.2 mm from the root apex. The concentrations of Se in each tissue at virtual sections were estimated using the mathematical model (for details, see Wang et al., 2013). All roots were enclosed in 4-µm-thick Ultralene films and scanned simultaneously, allowing valid comparisons among treatments. The endodermis is included in the model at a distance of 0.6 mm, although it is likely not to be suberized this close to the apex. [See online article for color version of this figure.]

