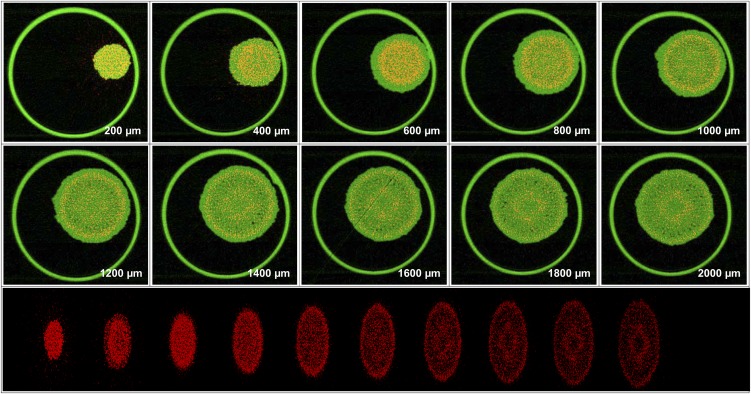
Figure 6.
Tomograms (virtual cross sections) taken in the apex of a root exposed to 20 µm Se[IV] for 24 h. The tomograms are collected 200 to 2,000 µm from the apex in intervals of 200 µm. The bottom compilation of tomograms is a single frame captured from a reconstructed three-dimensional animation of the plant root (Supplemental Video S2). Red represents Se distribution, and green represents Compton (mass) signal. The large outer circle in the tomograms is the 810-µm-diameter capillary tube in which the root is held. [See online article for color version of this figure.]

