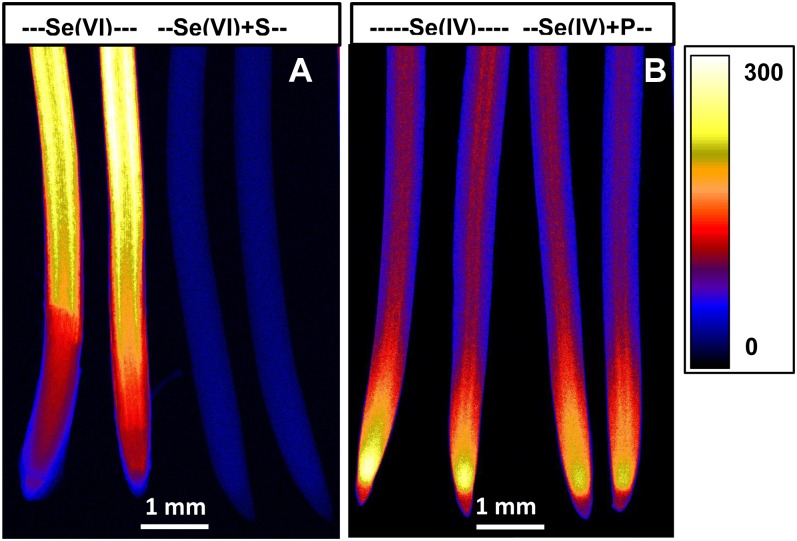
Figure 8.
Imaging of Se in cowpea roots exposed to 20 µm Se[VI] (A) or Se[IV] (B) in the presence or absence of 10 mm Na2SO4 (+S) or 0.1 mm NaH2PO4 (+P) for 24 h using µ-XRF. All roots were enclosed in 4-µm-thick Ultralene films and scanned simultaneously, allowing valid comparisons among treatments. The range in projected µ-XRF concentration (µg g−1 in fresh root tissue) is shown as a color scale. [See online article for color version of this figure.]

