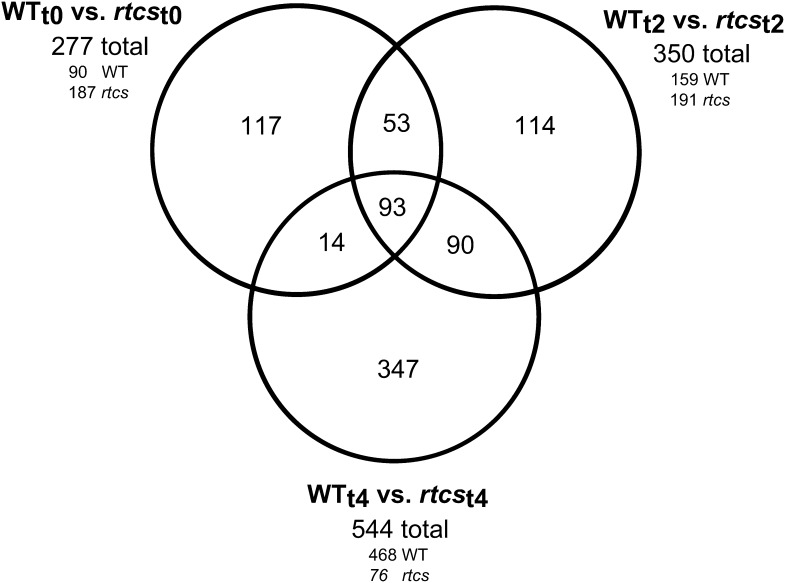
Figure 2.
Differential expression of 828 unique genes between wild-type and rtcs coleoptilar nodes at three developmental stages (t0, t2, and t4). The Venn diagram illustrates the number of differentially expressed genes for all three pairwise comparisons and the number of genes overlapping between the comparisons. For each developmental stage, the total number of differentially expressed genes and the number of genes preferentially expressed in the wild type (WT) and rtcs are indicated.

