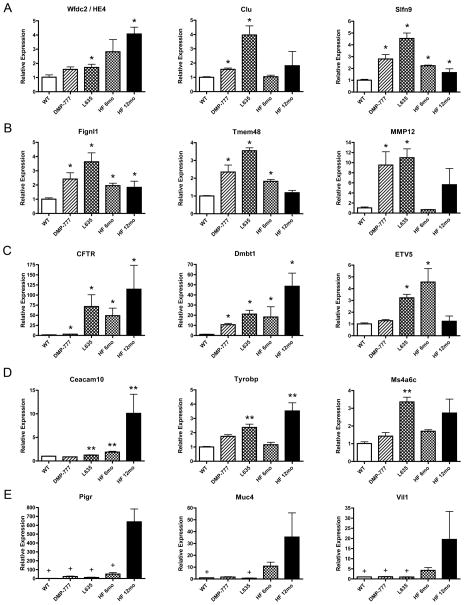
Figure 2. Quantitative Real Time PCR assay of selected upregulated transcripts from each comparison category.
Expression of selected upregulated transcripts from each category was assessed by qRT-PCR in RNA isolated from the whole fundic stomach (3 mice per group). Pan-SPEM (A) and Acute SPEM (B) transcripts were associated with the emergence of SPEM, while SPEM with Inflammation (C), Specific to SPEM with Inflammation (D), and SPEM with Chronic Inflammation (E) relate to the progression of SPEM lineages. Results are shown as fold change as compared to the mean value of the control group (labeled WT). Single asterisks in A, B, and C signify significant upregulation as compared to WT. Double asterisks in D are significant as compared to DMP-777-induced SPEM. Significance in E (+) is noted as compared to 12 month H. felis infection. All values are shown as means +/− standard error of the mean, SE. (p < 0.05 by Mann-Whitney U test).

