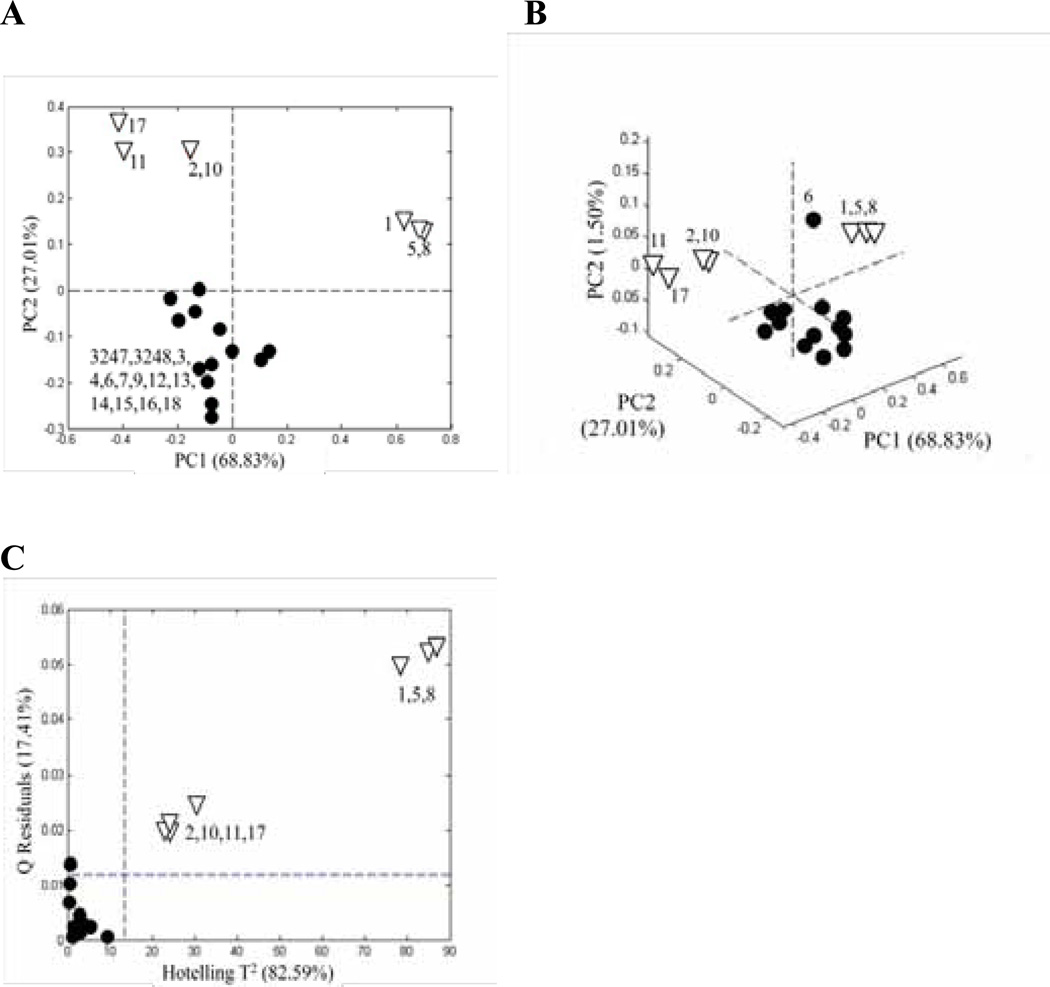
Figure 3.
Relative peak areas: (A) PCA score plots based on the relative peak areas for the Ginkgo biloba supplements in Figure 2 with two principal components, (B) PCA score plots with three principal components, and (C) Q residuals versus Hotelling T2 for SIMCA based on a PCA model for relative peak areas of the authentic supplements. (•) authentic supplements and (∇) adulterated supplements. Each point represents the average of 3 repeat analyses.

