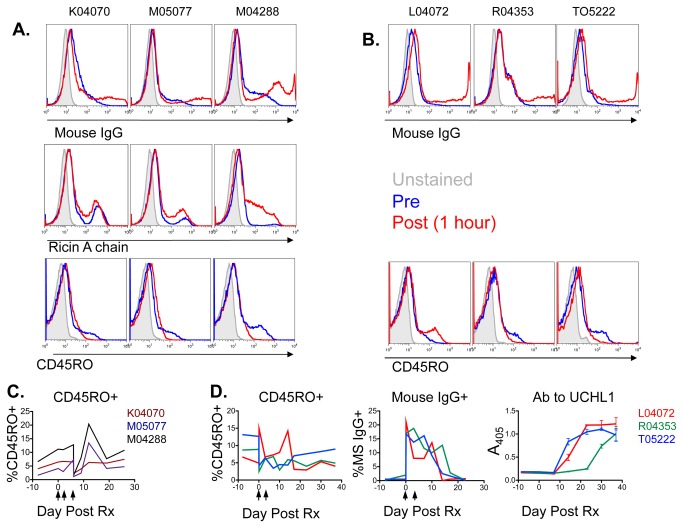
Figure 10. In vivo administration of UCHL1 immunotoxin or mAb.
Groups of three aviremic SHIV-infected macaques each received escalating doses of UCHL1-ricin A chain immunotoxin (panels A and C) or UCHL1 mAb (panels B and D). A. Flow cytometry was performed prior to (blue histograms) and 1hr following (red) administration of the third dose of UCHL1-ricin A chain immunotoxin. Cells were stained with antibody specific for mouse IgG (top), ricin A chain (middle), or CD45RO (bottom). B. Flow cytometry was performed prior to and one hour following the first administration of UCHL1 mAb. Cells were stained with antibody specific for mouse IgG (top) or CD45RO (bottom). C. Percent of CD3+ cells that express CD45RO was followed with time using flow cytometry. Day 0 indicates the start of immunotoxin administration (vertical arrows). D. The effects of administering UCHL1 mAb were followed over time. Day 0 indicates the start of mAb administration (vertical arrows). Left: percent of CD3+ cells that express CD45RO, measured by flow cytometry. Middle: percent of cells detected with fluorescent anti-mouse IgG, measured by flow cytometry. Right: macaque anti-UCHL1 antibody measured by ELISA.

