
Figure 4. Overall lipidome response of S. cerevisiae and Z bailii cultured with and without acetic acid.
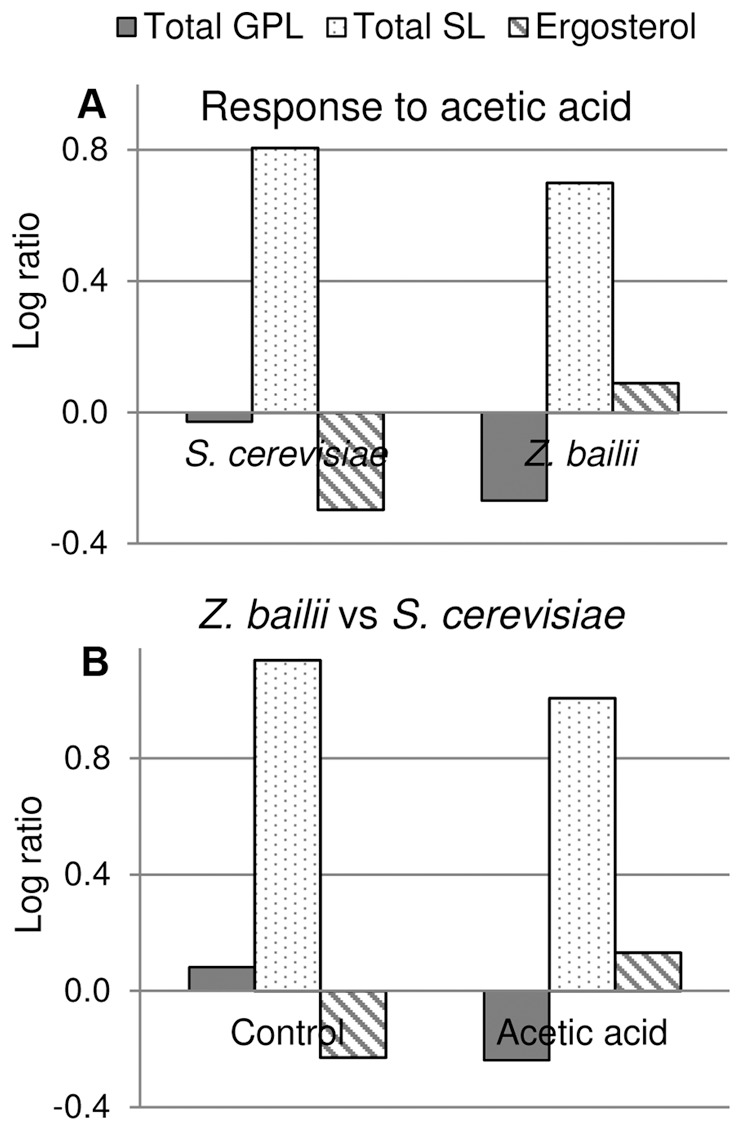
S. cerevisiae was cultured with 9 g L−1 acetic acid and Z. bailii with 24g L−1 acetic acid. A. Response of S. cerevisiae and Z. bailii to acetic acid. B. Comparison of S. cerevisiae to Z. bailii under control conditions and acetic acid stress. Total sphingolipids is an approximation as absolute quantities are not available (see Materials and Methods). The results were calculated from biological replicates (n = 4) and are given as the mean ± standard deviation.