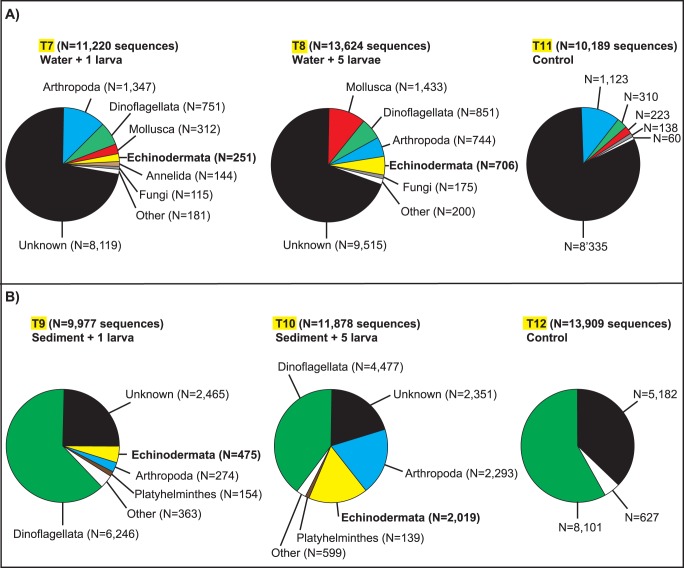
Figure 3. Environmental DNA/Spiking experiment.
Pie charts depict the proportion of marine phyla identified via BLASTn searches from environmental samples spiked with 1 larva (T7, T9), 5 larvae (T8, T10) or no larva (controls T11, T12) of Asterias amurensis (i.e., phylum Echinodermata; shown in bold) from A) one water and B) one sediment sample. A detailed taxonomic list of marine taxa, sequences lengths, minimum e-values, mean similarity, and number of best sequence hits to known NCBI sequences are shown for each treatment in Table S2.

