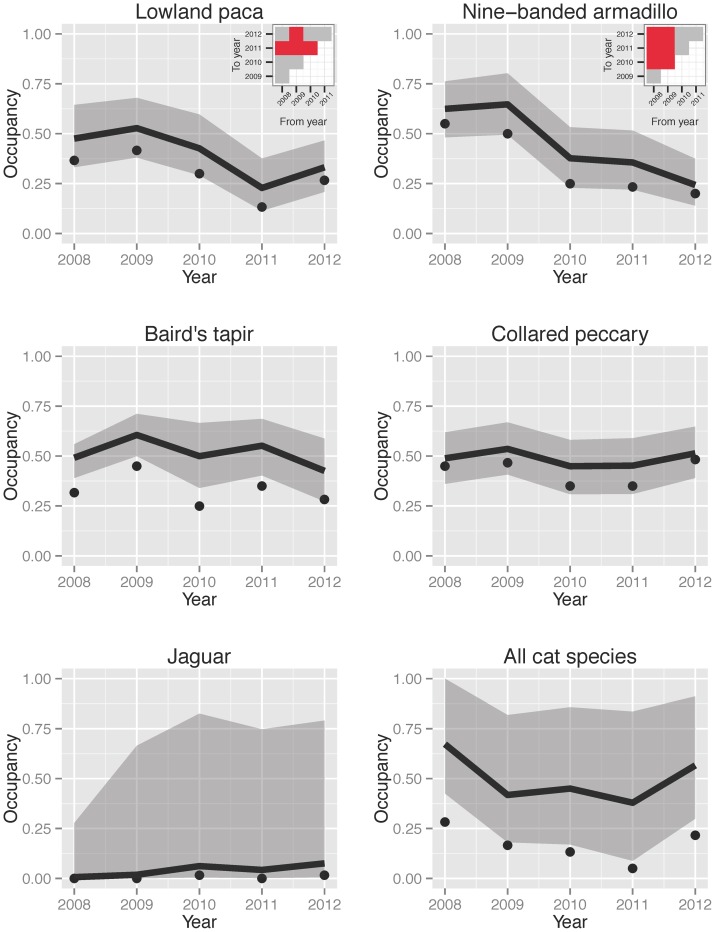
Figure 2. Temporal dynamics in occupancy for selected species.
Occupancy dynamics for Lowland paca (A), Nine-banded armadillo (B), Baird's tapir (C), Collared peccary (D), Jaguar (E) and all cat species combined –Ocelot, Margay, Jaguar, Puma and Jaguarundi– (F). Observed occupancies (naive) are shown as points, and modeled occupancy is shown as a solid line (median or mode of the posterior distribution). The shaded gray region spans the highest posterior density intervals for occupancy. The small inset graphs in A and B symbolize the statistical signal of λ between any two particular years. Values of λ significantly smaller than 1 are symbolized in red; values not significantly different from 1 are symbolized by grey. These are not shown for panels C,D,E and F because λ was not significantly different from 1 between years for any of these species.

