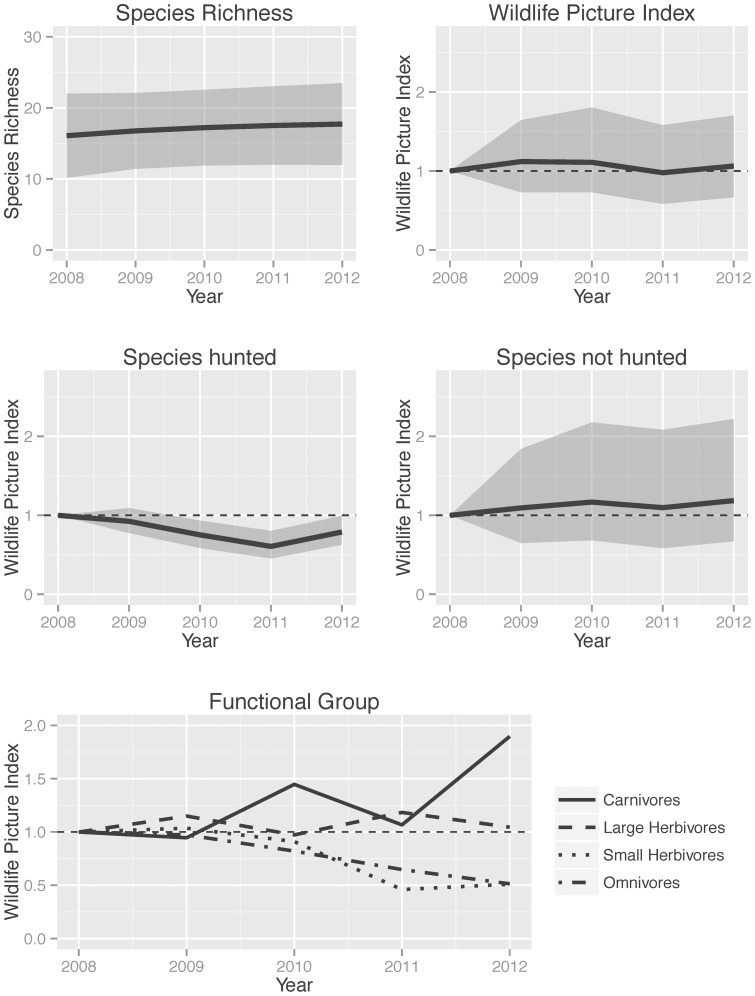
Figure 3. Comparison of different metrics of community dynamics.
A. Modeled changes in mammal species richness at Volcan Barva transect, Costa Rica. The solid line shows the estimated value of richness and the shaded grey region spans the 95% confidence limits of the estimated distribution. B. Temporal changes in the Wildlife Picture Index (WPI) of 13 mammal species at Volcan Barva. The solid line is the mode of the posterior distribution of the WPI for each year and the shaded area spans the highest posterior density intervals for the WPI. Temporal changes in the WPI when it is disaggregated for species that are coveted by hunters (C) –Lowland paca, Central American agouti, Collared peccari– and species that are not normally hunted in the area (D) –all other species. E. Temporal changes in the WPI when it is disaggregated by functional groups of species; high posterior densities for each group are not shown for simplicity. The only group with a WPI significantly smaller than 1 in 2012 is the small herbivore group.

