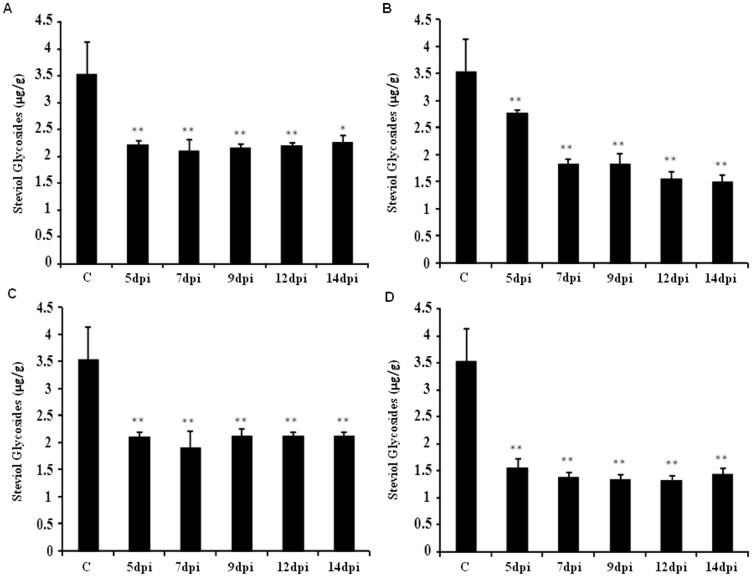
Figure 4. Steviol glycoside content measured on 5, 7, 9 and 12 days post infiltration (dpi) with respect to control.
The level of steviol glycosides was estimated using HPLC in leaves of control and agroinfiltrated Stevia. Bar diagram shows the steviol glycoside content on AMTS of (A) SrKA13H, (B) SrUGT85C2, (C) SrUGT74G1 and (D) SrUGT76G1. Data presented as mean±standard deviation of three independent measurements, (**, P<0.01; *P<0.05).

