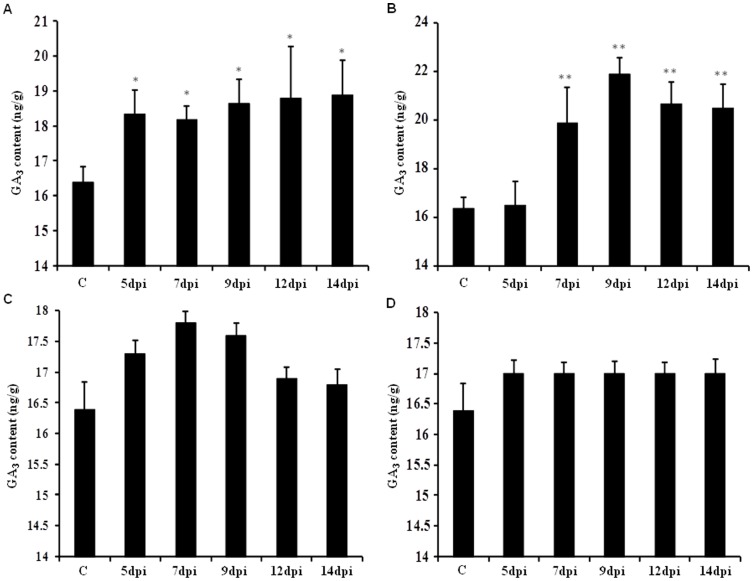
Figure 5. GA3 content estimated on 5, 7, 9 and 12 days post infiltration (dpi) with respect to control.
Graphical representation of gibberellin content on transient silencing of (A) SrKA13H, (B) SrUGT85C2, (C) SrUGT74G1 and (D) SrUGT76G1. GA3 content was increased to a higher extent on transient silencing of SrKA13H and SrUGT85C2 than noticed during SrUGT74G1 and SrUGT76G1 silencing. Data represented as mean±standard deviation of three independent measurements, (**, P<0.01; *, P<0.05).

