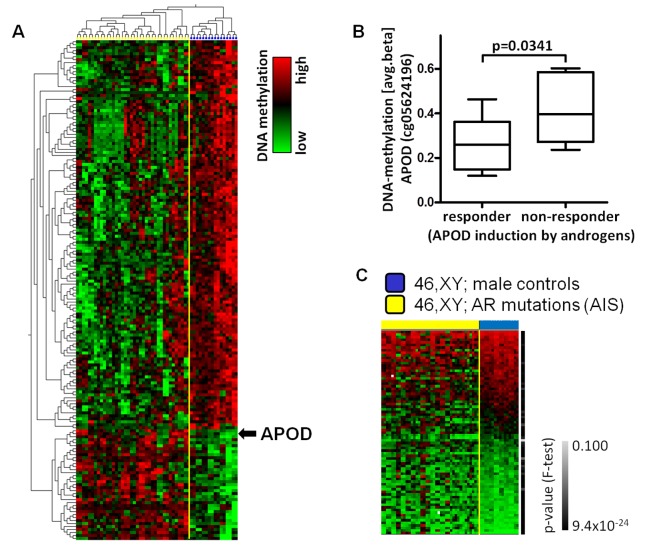
Figure 1. Array-based DNA methylation analysis of 26 AIS genital fibroblasts and 8 male control genital fibroblasts.
(A) Supervised cluster analysis of DNA-methylation data obtained from genital fibroblasts separates individuals with AIS (yellow) from male controls (blue) (q<0.04). DNA-methylation is presented on a relative scale. To demonstrate reproducibility all hybridizations performed in duplicates are shown separately. (B) DNA-methylation of APOD (cg05624196) in fibroblasts lacking induction of APOD upon androgen treatment (non-responder) was significantly higher compared to responding fibroblasts (responder). (C) Variability in the DNA-methylation in AIS (yellow) compared to male controls (blue). Green: low, black: medium, red: high avg-beta values. The right bar indicates p-value (F-test).

