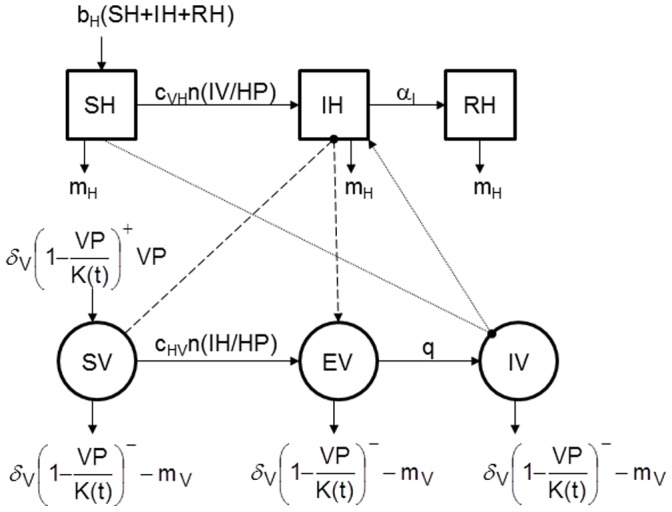
Figure 1. Conceptual model of the spread of a vector-borne pathogen during favourable period.

Squares represent the health states of hosts, circle those of vectors. Solid lines represent transitions between health statuses, dashed lines represent the host-to-vector transmission (when a susceptible vector (SV) bites an infectious host (IH) and becomes exposed but not yet infectious (EV)), and dotted lines represent the vector-to-host transmission (when an infectious vector (IV) bites a susceptible host (SH) which becomes infectious (IH)). Parameters are defined in Table 1.
