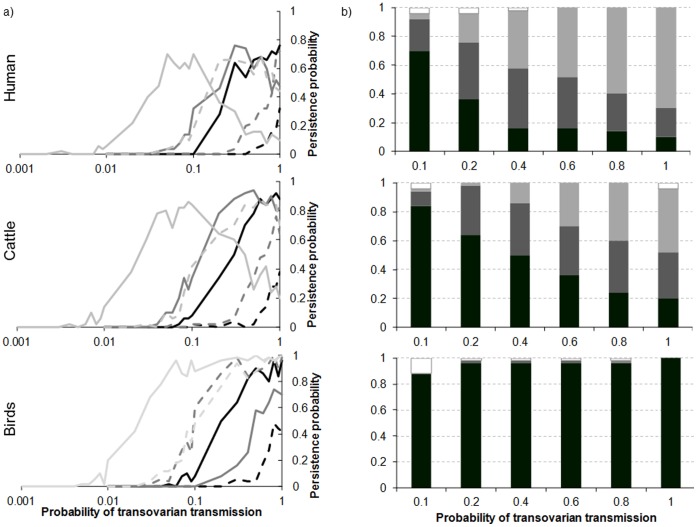
Figure 9. Persistence (a) and extinction dates (b) as a function of host regime, probability of transovarian transmission in the vector (gV), length of the period on which is calculated the population of infected vectors entering diapause (inter), and number of vectors emerging after the unfavourable period (Nbd).
a) in black inter = [1: 243], in dark grey inter = [123: 243], in light grey inter = [230: 243]: solid line Nbd = 50000; dashed line Nbd = 10000. b) Nbd = 50000 and inter = [230: 243]. In black, persistence. In shades of grey, from darkest to lightest, extinction the 5th, 4th, 3rd year after introduction, respectively. In white, extinction the 2nd year.

