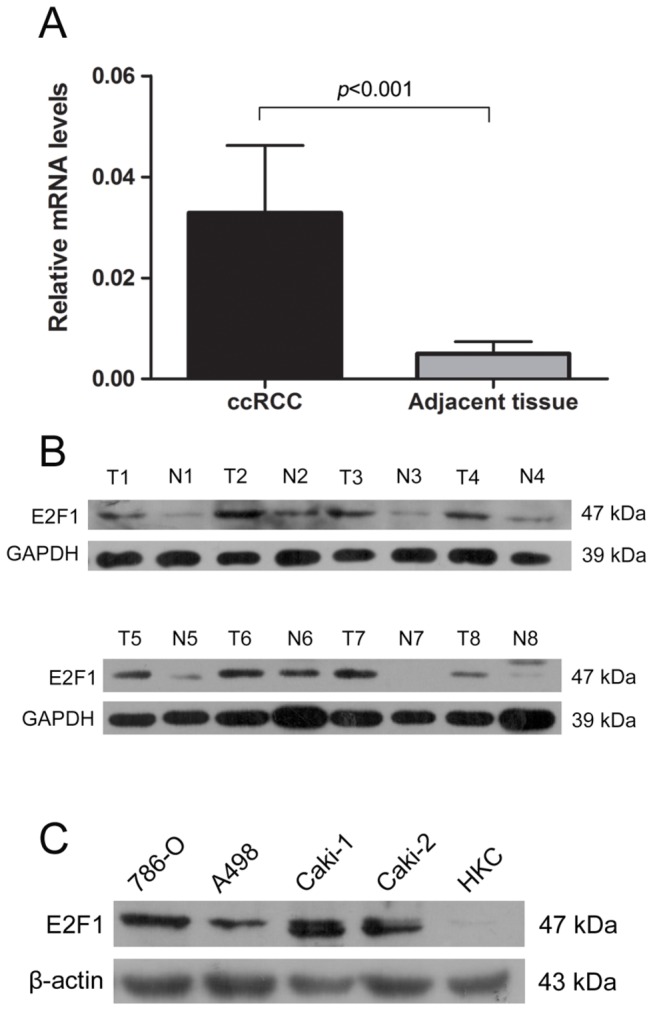
Figure 2. Comparison of mRNA and protein levels expression of E2F1 in ccRCC tissues and their corresponding adjacent non-cancerous kidney tissues.

(A) Result of E2F1 mRNA expression difference in tumor group and normal renal tissue group(p<0.001). (B) Western blot analysis of the consisted proteins of E2F1 in tumor group (T) relative to normal renal tubule cell group (N). Glyceraldehyde-3-phosphate dehydrogenase (GAPDH) was used as internal control for equal loading of samples. (C) Expressions of E2F1 protein in ccRCC cell lines and human renal tubule cell line (HKC) with the control ofβ-actin.
