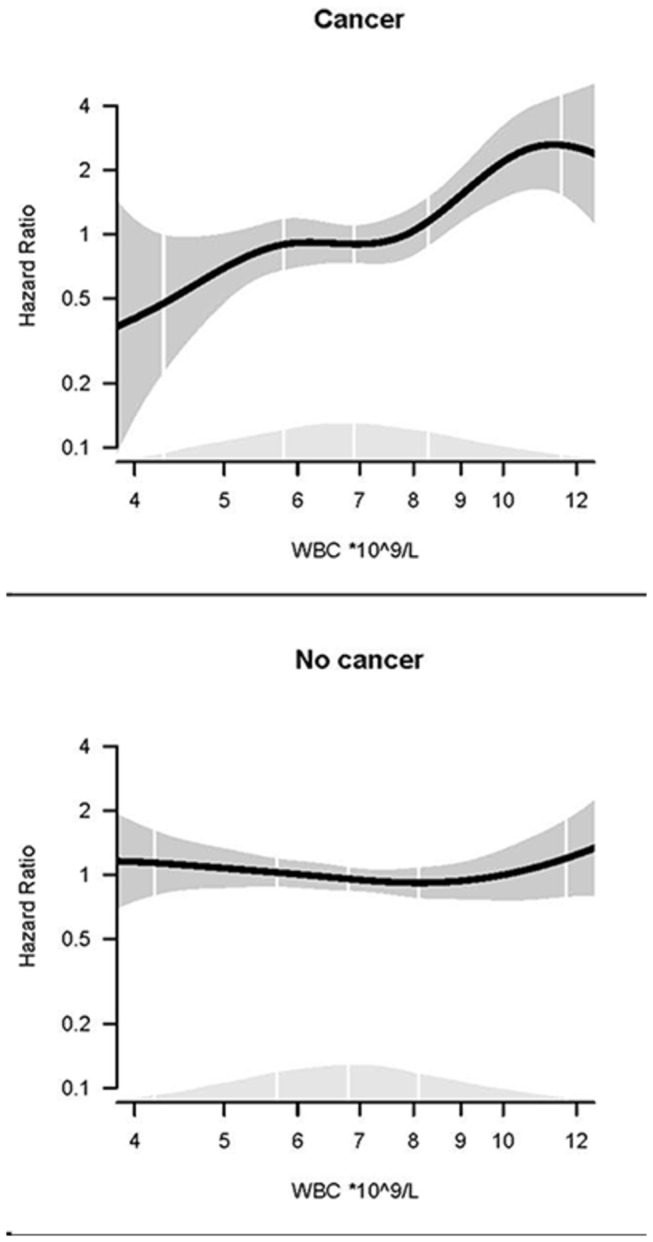
Figure 1. WBC count and risk of venous thromboembolism.

Dose–response relationship between WBC count and risk of VTE in cancer and non-cancer subjects obtained by generalized linear regression. The regression models are adjusted for age, sex, BMI, smoking, self-reported diabetes, physical activity and self-reported CVD. The solid lines show HRs and the shaded areas show 95% CIs. Density plots show the distribution of WBC, and white vertical lines indicate 2.5th, 25th, 50th, 75th and 97.5th percentiles.
