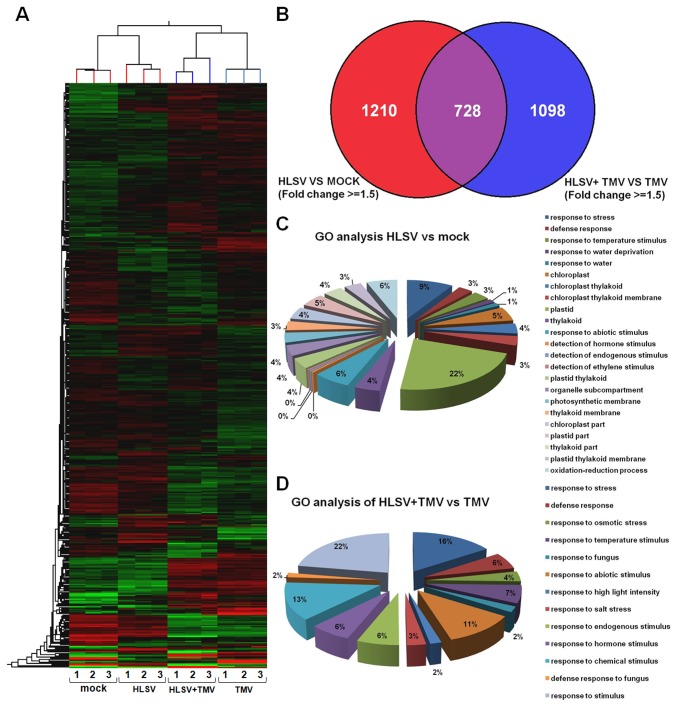
Figure 3. Hierarchical cluster analysis of transcriptional profiles and gene ontology analysis.
(A) A hierarchical cluster analysis of transcriptional profiles for 24237 genes or ESTs of Nicotiana benthamiana inoculated with inoculation buffer (mock), HLSV, HLSV+TMV (plants cross protected by pre-inoculation of HLSV 12 days prior to TMV challenge inoculation). The 3 columns correspond to biological repeats after inoculation with buffer (mock), HLSV, HLSV+TMV and TMV (at 12 dpi for mock and HLSV, and 3 dpi for HLSV+TMV and TMV which is equal to 15 dpi of HLSV). The clustering on the top of hierarchical map represents the differences among samples and biological repeats, while the left clustering is based on the expression levels of different genes. (B) Venn diagram of genes in response to HLSV infection and cross protection. (C) HLSV infection. (D) Gene ontology (GO) analysis of genes in response to HLSV+TMV infection (cross protection).

