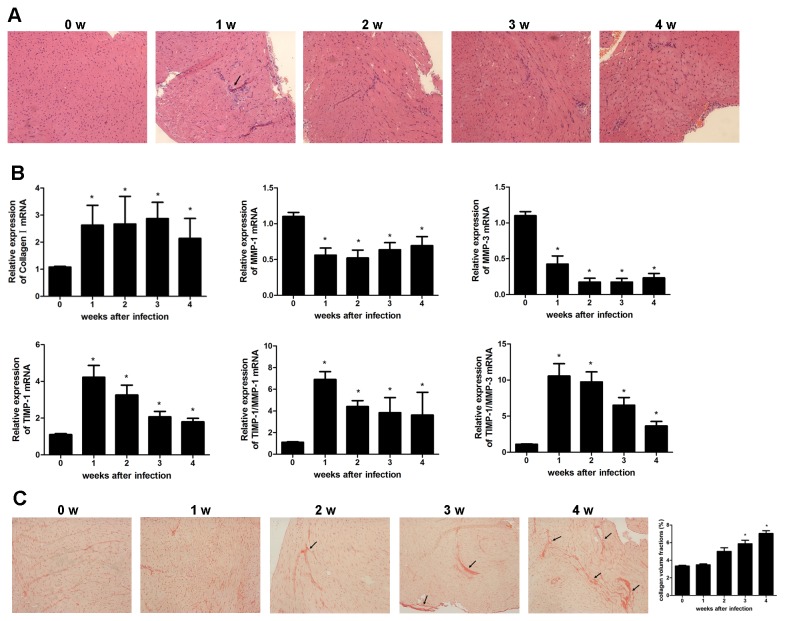
Figure 1. Mice have increased myocardial fibrosis after CVB3 infection.
(A) Groups of 8 mice were infected with 10 TCID50 dose of CVB3, the myocardial inflammation was shown by H&E staining 4 wks after infection. Representative heart sections were shown for each week (magnification: 200×). Arrows indicate inflammatory cell infiltrate. (B) At 1,2,3,4 wks after CVB3 infection, the mRNA expression levels of matrix proteins (collagen I, MMP-1, MMP-3, TIMP-1) were determined by quantitative real time-PCR. Data are from one representative experiment of three performed ones and represent as the mean±SEM. (C) Picrosirius-red stained heart sections of CVB3-infected mice revealed increased fibrosis (red) (magnification: 200×). Arrows indicate myocardial interstitial and perivascular fibrosis. The severity of fibrosis was scored by collagen volume fractions and represent as mean ± SEM of three separate experiments. *, P<0.05 compared to the non-infected mice (wk0).

