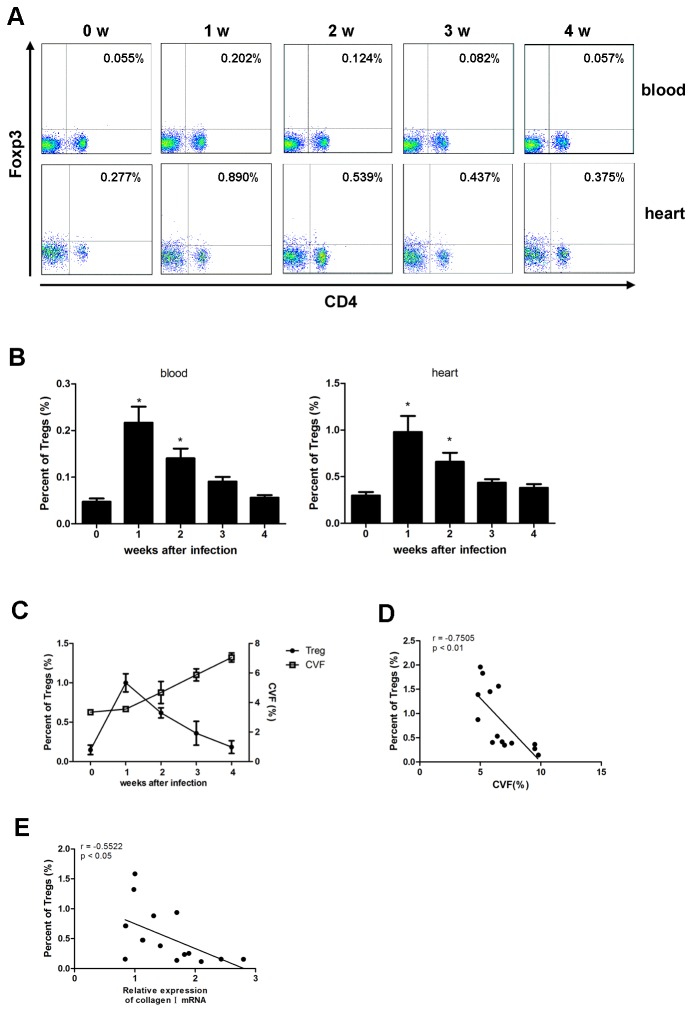
Figure 2. Treg frequency has negative correlation with severity of cardiac fibrosis.
Groups of 20 mice were infected with 10 TCID50 dose of CVB3, 1,2,3,4 wks after infection, spleen and myocardial infiltrated cells were subjected to, flow cytometry protocol and stained for PerCP-CD4 and PE-Foxp3. (A) Frequencies of peripheral and myocardial Tregs were shown, graph representative of three independent experiments. (B) Relative numbers of Treg frequency. Data. represent as mean ±SEM. *, P<0.05 compared to non-infected mice (wk0). N=5 mice per group (C) Myocardial Treg frequency and the relative collagen volume fraction (CVF) of heart tissue were parallelly shown in one graph. (D and E) 4 weeks after CVB3 infection, peripheral Treg frequency and CVF or collagen I mRNA in each mouse were analyzed and correlated.

