
Figure 3. DNA methylation levels in heart.
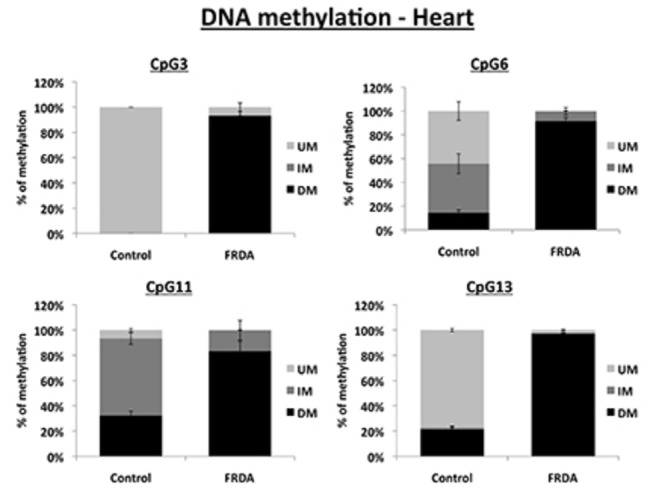
MethylScreen analysis of four CpG sites in the FXN upstream GAA repeat region of DNA from FRDA and control heart tissues. UM = unmethylated, IM = intermediately methylated, DM = densely methylated. Error bars = s.e.m. n=4.