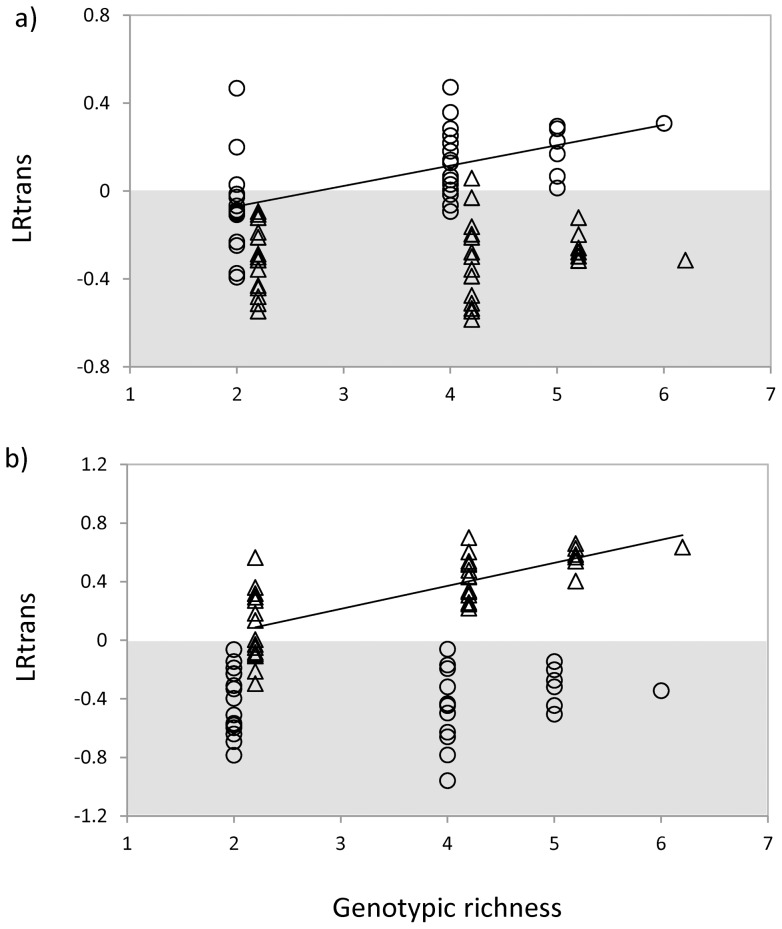
Figure 3. Effect of genotypic richness on transgressive overyielding LRtrans.
a) Bacteria from Cravo Sur (dots) and from Gloria Norte (triangles) tested on crude from Cravo Sur. For bacteria from Cravo Sur: r2 = 0.313, p = 0.003; for bacteria from Gloria Norte: r2 = 0.011, p = 0.531. b) Bacteria from Cravo Sur (dots) and from Gloria Norte (triangles) tested on crude from Gloria Norte. For bacteria from Cravo Sur: r2 = 0.004, p = 0.683; for bacteria from Gloria Norte: r2 = 0.543, p<0.001. Each point represents a polyculture with different species composition. Solid lines represent significant correlation between genotypic richness and transgressive overyielding LRtrans. Grey areas represent negative values.

