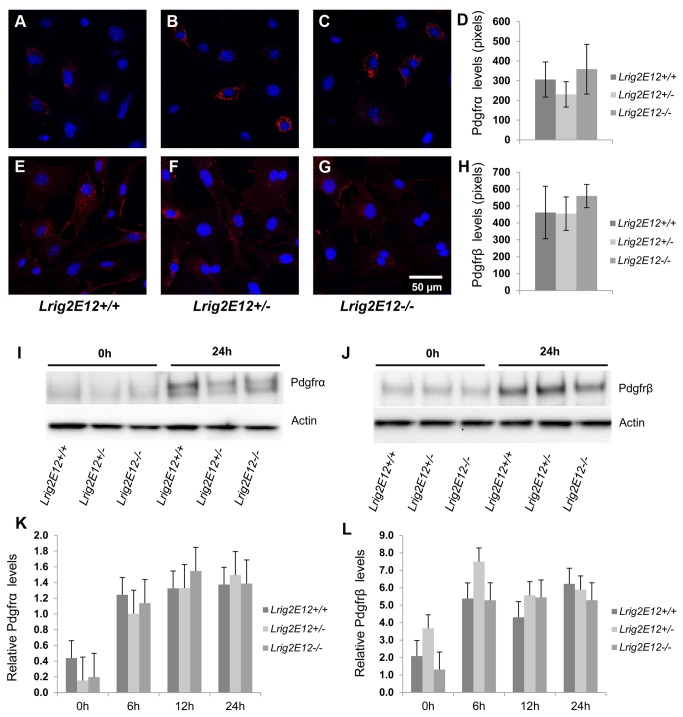
Figure 5. Pdgfr levels in serum-starved primary MEFs.
Wild-type (Lrig2E12+/+), heterozygous (Lrig2E12+/-), or Lrig2-deficient (Lrig2E12-/-) MEF cell lines were serum-starved for the indicated times followed by analysis of Pdgfr levels using immunofluorescence microscopy (A–H) or immunoblotting (I–L). (A–H) Cells were serum starved for 24 hours followed by analysis of Pdgfrα (A–D) or Pdgfrβ (E–H) levels using immunofluorescence microscopy. Pdgfr immunoreactivity was visualized with Alexa-conjugated secondary antibodies (red), and the nuclei were counter-stained with DAPI (blue). (D, H) Quantifications of the Pdgfrα and Pdgfrβ immunofluorescence levels, respectively. Shown are the means from three independent experiments, including wild-type (n=8), heterozygous (n=9), and Lrig2-deficient (n=6) cell lines from three different litters, with standard deviations indicated by error bars. There were no differences observed in Pdgfrα or Pdgfrβ protein levels, as determined by quantitative immunofluorescence microscopy, between cells of different Lrig2 genotypes. (I–L) Cells were serum starved for 0, 6, 12 or 24 hours followed by cell lysis and Western blot analyses with antibodies against Pdgfrα, Pdgfrβ, or, as a loading control, actin. Representative immunoblots of Pdgfrα (I) and Pdgfrβ (J) in wild-type (Lrig2E12+/+), heterozygous (Lrig2E12+/-), and Lrig2-deficient (Lrig2E12-/-) cells after 0 or 24 hours of serum starvation. (K–L) Quantifications of Pdgfrα (K) and Pdgfrβ (L) immunoblots in wild-type, heterozygotes and Lrig2-deficient cells after 0, 6, 12 and 24 h starvation. Shown are the means from three independent experiments including wild-type (n=8), heterozygous (n=9), and Lrig2-deficient (n=6) cell lines from three different litters, with standard deviations indicated by error bars. There were no differences observed in Pdgfrα or Pdgfrβ protein levels as determined by immunoblotting, between cells of different Lrig2 genotypes.

