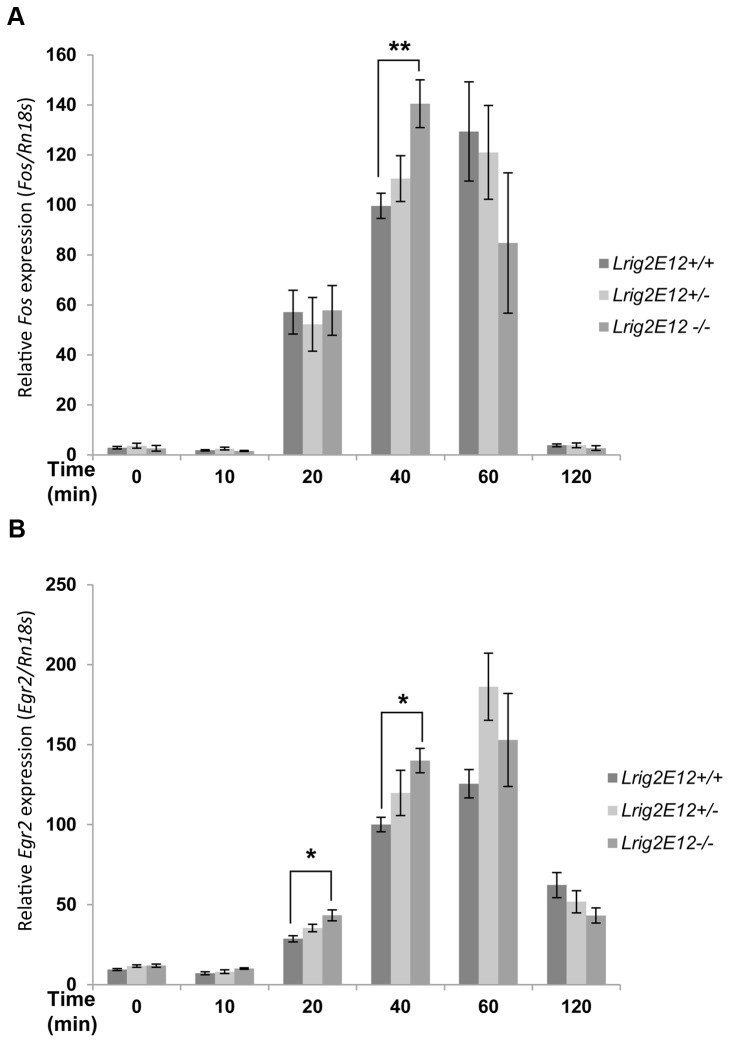
Figure 8. The effect of Lrig2 on the induction of immediate-early gene expression.
Wild-type (Lrig2E12+/+), heterozygous (Lrig2E12+/-), or Lrig2-deficient (Lrig2E12-/-) MEFs were serum starved for 24 hours followed by stimulation with PDGF-BB for 0, 10, 20, 40, 60, or 120 minutes. Thereafter, total RNA was prepared, and gene expression was quantified using real-time RT-PCR. Samples were run in triplicate, and the specific mRNA levels were normalized to respective Rn18s levels. Shown are the specific mRNA/Rn18s ratios on arbitrary scales. (A) Kinetics of relative Fos expression in cells stimulated with 50 ng/ml PDGF-BB. Shown are the means from three independent experiments, including wild-type (n=8), heterozygous (n=9), and Lrig2-deficient (n=6) cell lines from three different litters, with standard error of the means indicated by error bars. (B) Kinetics of relative Egr2 expression levels in cells stimulated with 10 ng/ml PDGF-BB. Shown are the means from two independent experiments, including wild-type (n=6), heterozygous (n=6), and Lrig2-deficient (n=4) cell lines from two different litters, with standard error of the means indicated by error bars. Compared with wild-type cells, the Lrig2-deficient cells showed altered and faster kinetics of induction of both Fos and Egr2 expression in response to PDGF-BB stimulation. Significant differences compared with the wild-type cell lines are indicated with asterisks (*p<0.05 and **p<0.01).

